Canadian vs Yuman Single Father Households
COMPARE
Canadian
Yuman
Single Father Households
Single Father Households Comparison
Canadians
Yuman
2.3%
SINGLE FATHER HOUSEHOLDS
79.7/ 100
METRIC RATING
157th/ 347
METRIC RANK
3.3%
SINGLE FATHER HOUSEHOLDS
0.0/ 100
METRIC RATING
334th/ 347
METRIC RANK
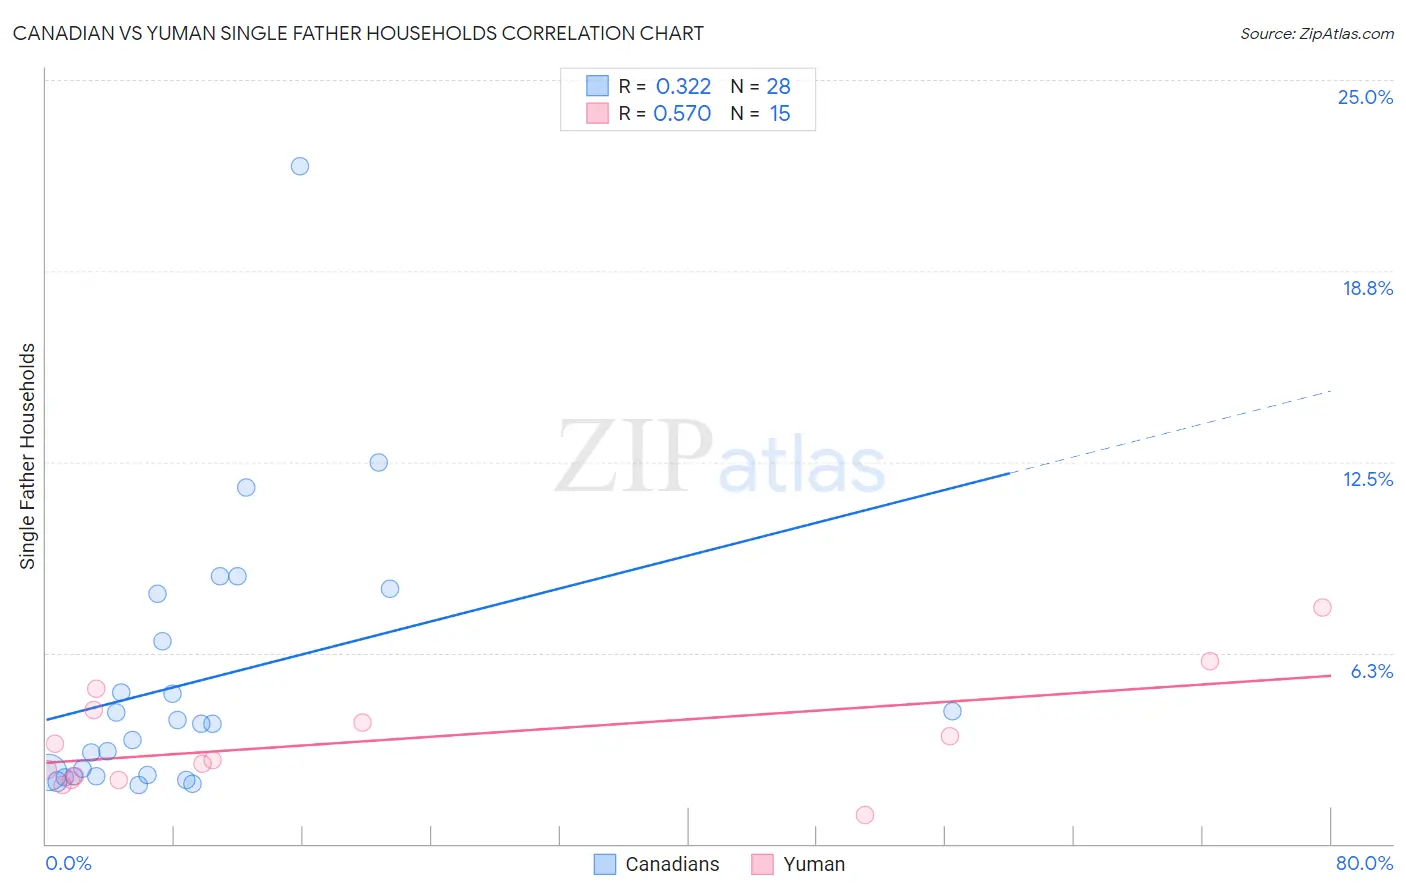
Canadian vs Yuman Single Father Households Correlation Chart
The statistical analysis conducted on geographies consisting of 432,424,973 people shows a mild positive correlation between the proportion of Canadians and percentage of single father households in the United States with a correlation coefficient (R) of 0.322 and weighted average of 2.3%. Similarly, the statistical analysis conducted on geographies consisting of 40,610,556 people shows a substantial positive correlation between the proportion of Yuman and percentage of single father households in the United States with a correlation coefficient (R) of 0.570 and weighted average of 3.3%, a difference of 44.6%.
Single Father Households Correlation Summary
| Measurement | Canadian | Yuman |
| Minimum | 1.9% | 0.94% |
| Maximum | 22.2% | 7.7% |
| Range | 20.3% | 6.8% |
| Mean | 5.3% | 3.4% |
| Median | 3.9% | 2.7% |
| Interquartile 25% (IQ1) | 2.2% | 2.1% |
| Interquartile 75% (IQ3) | 7.4% | 4.4% |
| Interquartile Range (IQR) | 5.2% | 2.3% |
| Standard Deviation (Sample) | 4.5% | 1.8% |
| Standard Deviation (Population) | 4.4% | 1.7% |
Similar Demographics by Single Father Households
Demographics Similar to Canadians by Single Father Households
In terms of single father households, the demographic groups most similar to Canadians are Immigrants from South America (2.3%, a difference of 0.020%), Immigrants from Senegal (2.3%, a difference of 0.030%), European (2.3%, a difference of 0.14%), Bolivian (2.3%, a difference of 0.16%), and Immigrants from West Indies (2.3%, a difference of 0.20%).
| Demographics | Rating | Rank | Single Father Households |
| Venezuelans | 86.2 /100 | #150 | Excellent 2.3% |
| Immigrants | Syria | 84.8 /100 | #151 | Excellent 2.3% |
| Immigrants | Venezuela | 83.2 /100 | #152 | Excellent 2.3% |
| Immigrants | Germany | 82.8 /100 | #153 | Excellent 2.3% |
| Bolivians | 81.0 /100 | #154 | Excellent 2.3% |
| Europeans | 80.9 /100 | #155 | Excellent 2.3% |
| Immigrants | South America | 79.9 /100 | #156 | Good 2.3% |
| Canadians | 79.7 /100 | #157 | Good 2.3% |
| Immigrants | Senegal | 79.4 /100 | #158 | Good 2.3% |
| Immigrants | West Indies | 77.9 /100 | #159 | Good 2.3% |
| Immigrants | Bolivia | 76.3 /100 | #160 | Good 2.3% |
| Swiss | 73.2 /100 | #161 | Good 2.3% |
| Scottish | 72.8 /100 | #162 | Good 2.3% |
| Irish | 72.1 /100 | #163 | Good 2.3% |
| Pakistanis | 70.6 /100 | #164 | Good 2.3% |
Demographics Similar to Yuman by Single Father Households
In terms of single father households, the demographic groups most similar to Yuman are Colville (3.3%, a difference of 0.020%), Paiute (3.3%, a difference of 0.050%), Pueblo (3.3%, a difference of 0.30%), Sioux (3.3%, a difference of 0.98%), and Alaskan Athabascan (3.4%, a difference of 2.5%).
| Demographics | Rating | Rank | Single Father Households |
| Bangladeshis | 0.0 /100 | #327 | Tragic 3.1% |
| Immigrants | Cabo Verde | 0.0 /100 | #328 | Tragic 3.1% |
| Chippewa | 0.0 /100 | #329 | Tragic 3.1% |
| Nepalese | 0.0 /100 | #330 | Tragic 3.1% |
| Navajo | 0.0 /100 | #331 | Tragic 3.2% |
| Yaqui | 0.0 /100 | #332 | Tragic 3.2% |
| Natives/Alaskans | 0.0 /100 | #333 | Tragic 3.2% |
| Yuman | 0.0 /100 | #334 | Tragic 3.3% |
| Colville | 0.0 /100 | #335 | Tragic 3.3% |
| Paiute | 0.0 /100 | #336 | Tragic 3.3% |
| Pueblo | 0.0 /100 | #337 | Tragic 3.3% |
| Sioux | 0.0 /100 | #338 | Tragic 3.3% |
| Alaskan Athabascans | 0.0 /100 | #339 | Tragic 3.4% |
| Alaska Natives | 0.0 /100 | #340 | Tragic 3.5% |
| Crow | 0.0 /100 | #341 | Tragic 3.5% |