Slovene vs Brazilian Single Father Households
COMPARE
Slovene
Brazilian
Single Father Households
Single Father Households Comparison
Slovenes
Brazilians
2.2%
SINGLE FATHER HOUSEHOLDS
98.5/ 100
METRIC RATING
107th/ 347
METRIC RANK
2.2%
SINGLE FATHER HOUSEHOLDS
92.8/ 100
METRIC RATING
139th/ 347
METRIC RANK
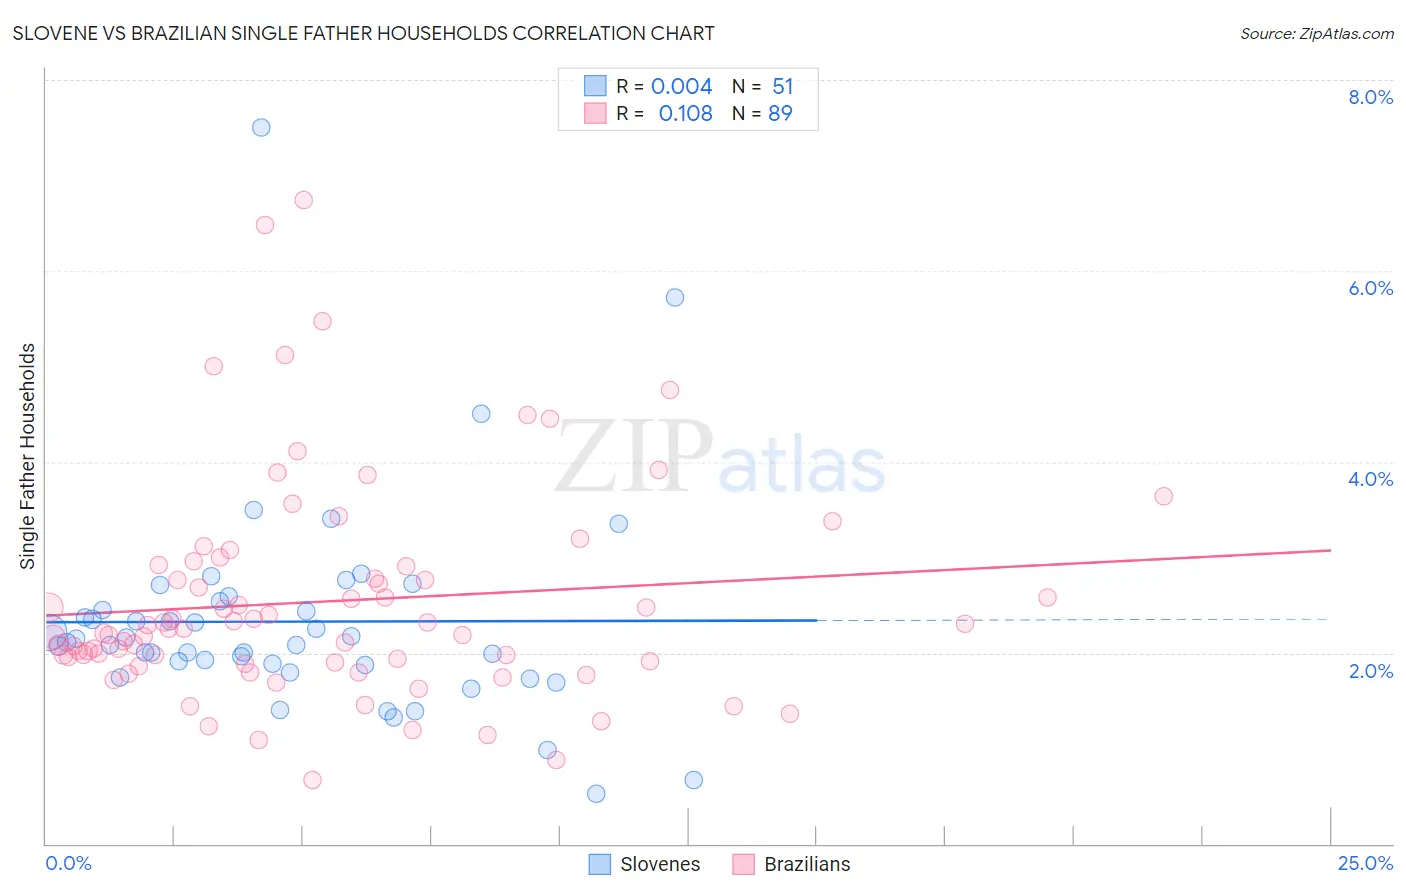
Slovene vs Brazilian Single Father Households Correlation Chart
The statistical analysis conducted on geographies consisting of 259,682,092 people shows no correlation between the proportion of Slovenes and percentage of single father households in the United States with a correlation coefficient (R) of 0.004 and weighted average of 2.2%. Similarly, the statistical analysis conducted on geographies consisting of 321,679,292 people shows a poor positive correlation between the proportion of Brazilians and percentage of single father households in the United States with a correlation coefficient (R) of 0.108 and weighted average of 2.2%, a difference of 3.2%.
Single Father Households Correlation Summary
| Measurement | Slovene | Brazilian |
| Minimum | 0.52% | 0.67% |
| Maximum | 7.5% | 6.7% |
| Range | 7.0% | 6.1% |
| Mean | 2.3% | 2.5% |
| Median | 2.1% | 2.2% |
| Interquartile 25% (IQ1) | 1.9% | 1.9% |
| Interquartile 75% (IQ3) | 2.5% | 2.9% |
| Interquartile Range (IQR) | 0.66% | 1.0% |
| Standard Deviation (Sample) | 1.1% | 1.1% |
| Standard Deviation (Population) | 1.1% | 1.1% |
Similar Demographics by Single Father Households
Demographics Similar to Slovenes by Single Father Households
In terms of single father households, the demographic groups most similar to Slovenes are Immigrants from Netherlands (2.2%, a difference of 0.020%), Barbadian (2.2%, a difference of 0.060%), Immigrants from Southern Europe (2.2%, a difference of 0.11%), Italian (2.2%, a difference of 0.19%), and Palestinian (2.2%, a difference of 0.23%).
| Demographics | Rating | Rank | Single Father Households |
| Immigrants | Northern Africa | 99.0 /100 | #100 | Exceptional 2.1% |
| Immigrants | Western Europe | 98.9 /100 | #101 | Exceptional 2.1% |
| Argentineans | 98.9 /100 | #102 | Exceptional 2.1% |
| Lebanese | 98.9 /100 | #103 | Exceptional 2.1% |
| Alsatians | 98.9 /100 | #104 | Exceptional 2.1% |
| Palestinians | 98.6 /100 | #105 | Exceptional 2.2% |
| Immigrants | Southern Europe | 98.6 /100 | #106 | Exceptional 2.2% |
| Slovenes | 98.5 /100 | #107 | Exceptional 2.2% |
| Immigrants | Netherlands | 98.5 /100 | #108 | Exceptional 2.2% |
| Barbadians | 98.4 /100 | #109 | Exceptional 2.2% |
| Italians | 98.3 /100 | #110 | Exceptional 2.2% |
| Immigrants | Canada | 98.3 /100 | #111 | Exceptional 2.2% |
| Immigrants | Trinidad and Tobago | 98.2 /100 | #112 | Exceptional 2.2% |
| Iraqis | 98.2 /100 | #113 | Exceptional 2.2% |
| Immigrants | North America | 98.2 /100 | #114 | Exceptional 2.2% |
Demographics Similar to Brazilians by Single Father Households
In terms of single father households, the demographic groups most similar to Brazilians are British (2.2%, a difference of 0.010%), Laotian (2.2%, a difference of 0.090%), Luxembourger (2.2%, a difference of 0.13%), Immigrants from Nepal (2.2%, a difference of 0.19%), and West Indian (2.2%, a difference of 0.42%).
| Demographics | Rating | Rank | Single Father Households |
| Poles | 96.5 /100 | #132 | Exceptional 2.2% |
| Taiwanese | 96.3 /100 | #133 | Exceptional 2.2% |
| Zimbabweans | 95.1 /100 | #134 | Exceptional 2.2% |
| Syrians | 94.8 /100 | #135 | Exceptional 2.2% |
| Chileans | 94.5 /100 | #136 | Exceptional 2.2% |
| Austrians | 94.2 /100 | #137 | Exceptional 2.2% |
| West Indians | 94.1 /100 | #138 | Exceptional 2.2% |
| Brazilians | 92.8 /100 | #139 | Exceptional 2.2% |
| British | 92.8 /100 | #140 | Exceptional 2.2% |
| Laotians | 92.5 /100 | #141 | Exceptional 2.2% |
| Luxembourgers | 92.3 /100 | #142 | Exceptional 2.2% |
| Immigrants | Nepal | 92.1 /100 | #143 | Exceptional 2.2% |
| Slovaks | 90.7 /100 | #144 | Exceptional 2.2% |
| Immigrants | Zimbabwe | 90.2 /100 | #145 | Exceptional 2.2% |
| Northern Europeans | 89.8 /100 | #146 | Excellent 2.2% |