Immigrants from Eastern Europe vs Malaysian Single Mother Households
COMPARE
Immigrants from Eastern Europe
Malaysian
Single Mother Households
Single Mother Households Comparison
Immigrants from Eastern Europe
Malaysians
5.6%
SINGLE MOTHER HOUSEHOLDS
98.4/ 100
METRIC RATING
70th/ 347
METRIC RANK
7.3%
SINGLE MOTHER HOUSEHOLDS
0.3/ 100
METRIC RATING
251st/ 347
METRIC RANK
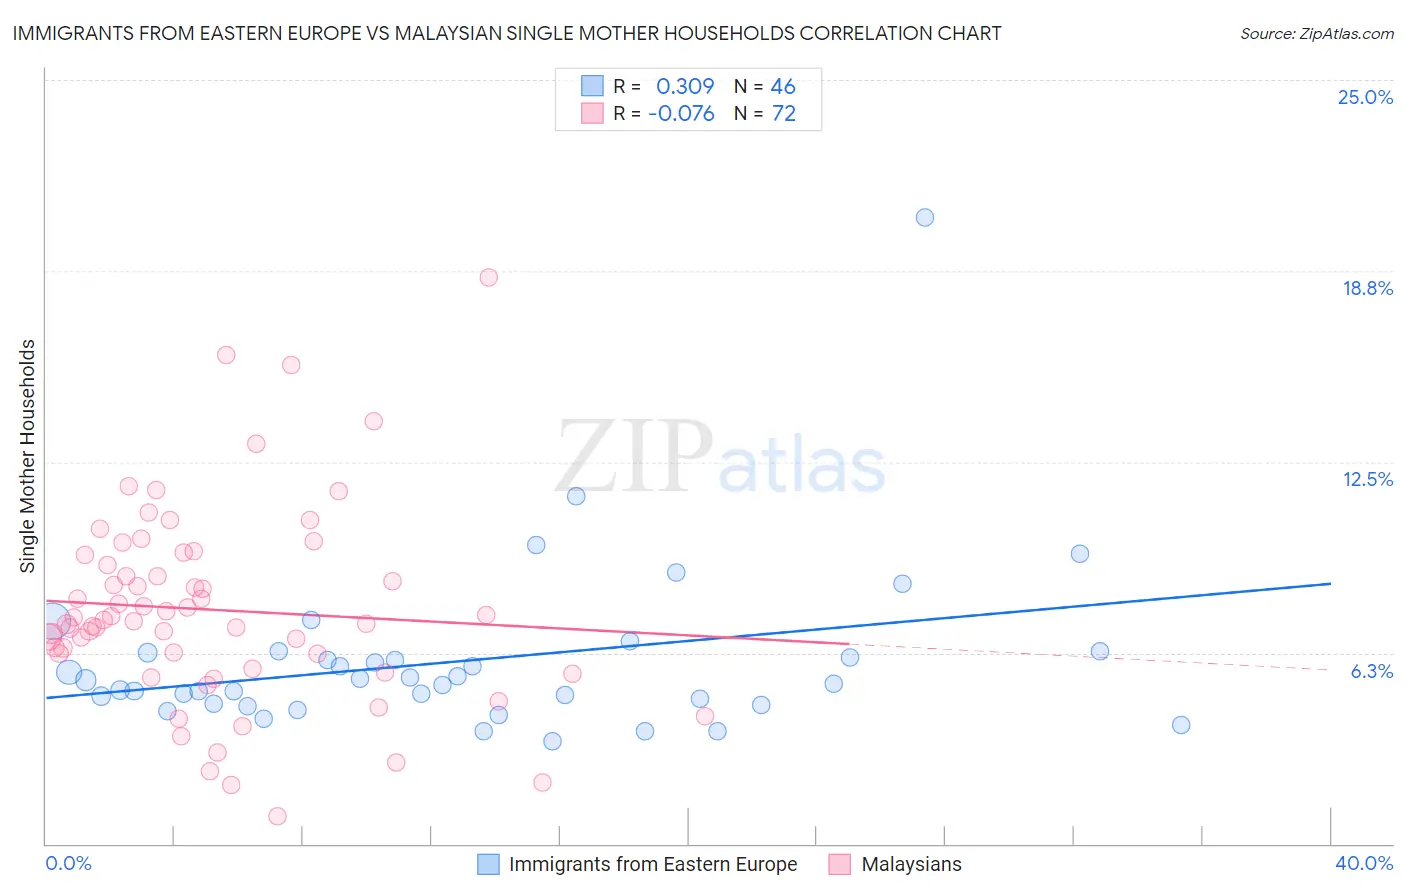
Immigrants from Eastern Europe vs Malaysian Single Mother Households Correlation Chart
The statistical analysis conducted on geographies consisting of 473,555,541 people shows a mild positive correlation between the proportion of Immigrants from Eastern Europe and percentage of single mother households in the United States with a correlation coefficient (R) of 0.309 and weighted average of 5.6%. Similarly, the statistical analysis conducted on geographies consisting of 225,856,339 people shows a slight negative correlation between the proportion of Malaysians and percentage of single mother households in the United States with a correlation coefficient (R) of -0.076 and weighted average of 7.3%, a difference of 30.6%.
Single Mother Households Correlation Summary
| Measurement | Immigrants from Eastern Europe | Malaysian |
| Minimum | 3.3% | 0.92% |
| Maximum | 20.5% | 18.5% |
| Range | 17.1% | 17.6% |
| Mean | 6.0% | 7.7% |
| Median | 5.3% | 7.3% |
| Interquartile 25% (IQ1) | 4.6% | 6.0% |
| Interquartile 75% (IQ3) | 6.3% | 9.3% |
| Interquartile Range (IQR) | 1.7% | 3.3% |
| Standard Deviation (Sample) | 2.8% | 3.2% |
| Standard Deviation (Population) | 2.7% | 3.2% |
Similar Demographics by Single Mother Households
Demographics Similar to Immigrants from Eastern Europe by Single Mother Households
In terms of single mother households, the demographic groups most similar to Immigrants from Eastern Europe are Immigrants from Kazakhstan (5.6%, a difference of 0.010%), Asian (5.6%, a difference of 0.080%), Immigrants from Bulgaria (5.6%, a difference of 0.10%), Immigrants from Netherlands (5.6%, a difference of 0.10%), and Immigrants from Asia (5.6%, a difference of 0.16%).
| Demographics | Rating | Rank | Single Mother Households |
| Immigrants | North Macedonia | 98.6 /100 | #63 | Exceptional 5.6% |
| Immigrants | France | 98.6 /100 | #64 | Exceptional 5.6% |
| Greeks | 98.6 /100 | #65 | Exceptional 5.6% |
| Immigrants | Canada | 98.5 /100 | #66 | Exceptional 5.6% |
| Italians | 98.5 /100 | #67 | Exceptional 5.6% |
| Immigrants | Bulgaria | 98.5 /100 | #68 | Exceptional 5.6% |
| Asians | 98.5 /100 | #69 | Exceptional 5.6% |
| Immigrants | Eastern Europe | 98.4 /100 | #70 | Exceptional 5.6% |
| Immigrants | Kazakhstan | 98.4 /100 | #71 | Exceptional 5.6% |
| Immigrants | Netherlands | 98.4 /100 | #72 | Exceptional 5.6% |
| Immigrants | Asia | 98.4 /100 | #73 | Exceptional 5.6% |
| Immigrants | North America | 98.3 /100 | #74 | Exceptional 5.6% |
| Slovenes | 98.3 /100 | #75 | Exceptional 5.6% |
| New Zealanders | 98.2 /100 | #76 | Exceptional 5.6% |
| Romanians | 98.1 /100 | #77 | Exceptional 5.6% |
Demographics Similar to Malaysians by Single Mother Households
In terms of single mother households, the demographic groups most similar to Malaysians are Alaskan Athabascan (7.3%, a difference of 0.020%), Immigrants from Africa (7.3%, a difference of 0.34%), Bermudan (7.3%, a difference of 0.36%), Cajun (7.3%, a difference of 0.41%), and Immigrants from Ecuador (7.3%, a difference of 0.46%).
| Demographics | Rating | Rank | Single Mother Households |
| Cubans | 0.6 /100 | #244 | Tragic 7.2% |
| Immigrants | Cambodia | 0.5 /100 | #245 | Tragic 7.2% |
| Nicaraguans | 0.5 /100 | #246 | Tragic 7.2% |
| Dutch West Indians | 0.4 /100 | #247 | Tragic 7.3% |
| Spanish American Indians | 0.4 /100 | #248 | Tragic 7.3% |
| Bermudans | 0.4 /100 | #249 | Tragic 7.3% |
| Immigrants | Africa | 0.4 /100 | #250 | Tragic 7.3% |
| Malaysians | 0.3 /100 | #251 | Tragic 7.3% |
| Alaskan Athabascans | 0.3 /100 | #252 | Tragic 7.3% |
| Cajuns | 0.3 /100 | #253 | Tragic 7.3% |
| Immigrants | Ecuador | 0.3 /100 | #254 | Tragic 7.3% |
| Mexican American Indians | 0.2 /100 | #255 | Tragic 7.4% |
| Seminole | 0.2 /100 | #256 | Tragic 7.4% |
| Alaska Natives | 0.2 /100 | #257 | Tragic 7.4% |
| Pueblo | 0.2 /100 | #258 | Tragic 7.4% |