Colombian vs Tongan Family Households with Children
COMPARE
Colombian
Tongan
Family Households with Children
Family Households with Children Comparison
Colombians
Tongans
28.3%
FAMILY HOUSEHOLDS WITH CHILDREN
99.6/ 100
METRIC RATING
87th/ 347
METRIC RANK
31.2%
FAMILY HOUSEHOLDS WITH CHILDREN
100.0/ 100
METRIC RATING
5th/ 347
METRIC RANK
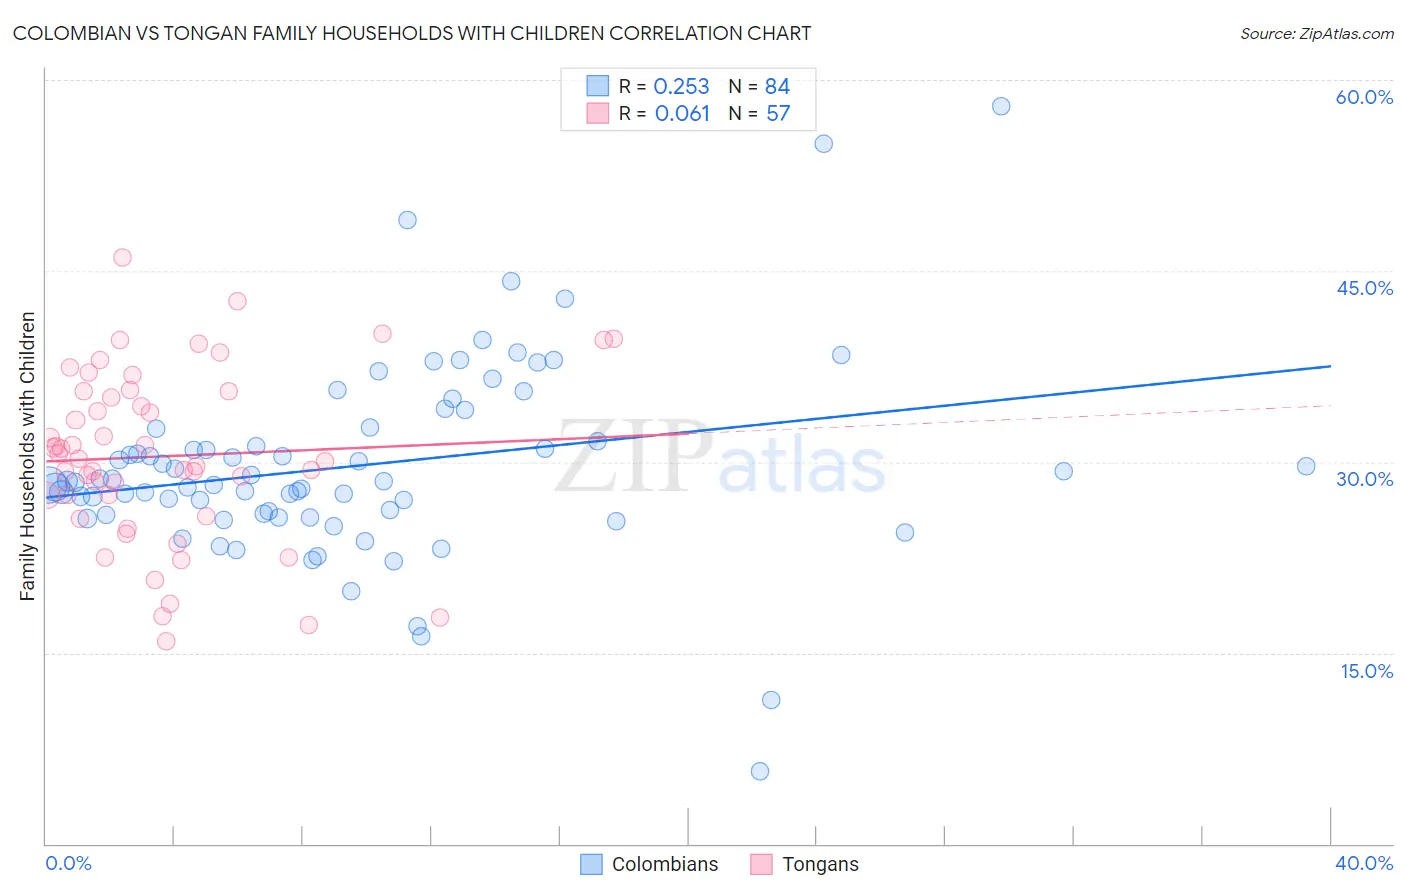
Colombian vs Tongan Family Households with Children Correlation Chart
The statistical analysis conducted on geographies consisting of 419,165,889 people shows a weak positive correlation between the proportion of Colombians and percentage of family households with children in the United States with a correlation coefficient (R) of 0.253 and weighted average of 28.3%. Similarly, the statistical analysis conducted on geographies consisting of 102,857,266 people shows a slight positive correlation between the proportion of Tongans and percentage of family households with children in the United States with a correlation coefficient (R) of 0.061 and weighted average of 31.2%, a difference of 10.5%.
Family Households with Children Correlation Summary
| Measurement | Colombian | Tongan |
| Minimum | 5.7% | 15.9% |
| Maximum | 57.9% | 46.0% |
| Range | 52.2% | 30.1% |
| Mean | 29.7% | 30.4% |
| Median | 28.4% | 30.2% |
| Interquartile 25% (IQ1) | 25.9% | 26.6% |
| Interquartile 75% (IQ3) | 32.1% | 35.5% |
| Interquartile Range (IQR) | 6.3% | 9.0% |
| Standard Deviation (Sample) | 7.7% | 6.8% |
| Standard Deviation (Population) | 7.7% | 6.7% |
Similar Demographics by Family Households with Children
Demographics Similar to Colombians by Family Households with Children
In terms of family households with children, the demographic groups most similar to Colombians are Liberian (28.3%, a difference of 0.010%), Immigrants from Costa Rica (28.3%, a difference of 0.020%), Immigrants from Western Africa (28.3%, a difference of 0.060%), Immigrants from Thailand (28.2%, a difference of 0.13%), and Immigrants from Liberia (28.2%, a difference of 0.18%).
| Demographics | Rating | Rank | Family Households with Children |
| Natives/Alaskans | 99.8 /100 | #80 | Exceptional 28.4% |
| South Americans | 99.8 /100 | #81 | Exceptional 28.4% |
| Kenyans | 99.8 /100 | #82 | Exceptional 28.4% |
| Nicaraguans | 99.8 /100 | #83 | Exceptional 28.4% |
| Costa Ricans | 99.8 /100 | #84 | Exceptional 28.4% |
| Immigrants | Syria | 99.8 /100 | #85 | Exceptional 28.4% |
| Immigrants | Western Africa | 99.6 /100 | #86 | Exceptional 28.3% |
| Colombians | 99.6 /100 | #87 | Exceptional 28.3% |
| Liberians | 99.6 /100 | #88 | Exceptional 28.3% |
| Immigrants | Costa Rica | 99.6 /100 | #89 | Exceptional 28.3% |
| Immigrants | Thailand | 99.5 /100 | #90 | Exceptional 28.2% |
| Immigrants | Liberia | 99.4 /100 | #91 | Exceptional 28.2% |
| Chickasaw | 99.4 /100 | #92 | Exceptional 28.2% |
| Panamanians | 99.3 /100 | #93 | Exceptional 28.2% |
| Immigrants | Colombia | 99.2 /100 | #94 | Exceptional 28.2% |
Demographics Similar to Tongans by Family Households with Children
In terms of family households with children, the demographic groups most similar to Tongans are Mexican (31.4%, a difference of 0.41%), Immigrants from India (31.0%, a difference of 0.62%), Immigrants from Central America (31.0%, a difference of 0.91%), Immigrants from Mexico (31.6%, a difference of 1.2%), and Yakama (30.8%, a difference of 1.5%).
| Demographics | Rating | Rank | Family Households with Children |
| Yup'ik | 100 /100 | #1 | Exceptional 37.0% |
| Inupiat | 100 /100 | #2 | Exceptional 32.8% |
| Immigrants | Mexico | 100.0 /100 | #3 | Exceptional 31.6% |
| Mexicans | 100.0 /100 | #4 | Exceptional 31.4% |
| Tongans | 100.0 /100 | #5 | Exceptional 31.2% |
| Immigrants | India | 100.0 /100 | #6 | Exceptional 31.0% |
| Immigrants | Central America | 100.0 /100 | #7 | Exceptional 31.0% |
| Yakama | 100.0 /100 | #8 | Exceptional 30.8% |
| Thais | 100.0 /100 | #9 | Exceptional 30.6% |
| Immigrants | Fiji | 100.0 /100 | #10 | Exceptional 30.5% |
| Nepalese | 100.0 /100 | #11 | Exceptional 30.5% |
| Immigrants | Pakistan | 100.0 /100 | #12 | Exceptional 30.2% |
| Afghans | 100.0 /100 | #13 | Exceptional 30.2% |
| Bangladeshis | 100.0 /100 | #14 | Exceptional 30.1% |
| Immigrants | South Central Asia | 100.0 /100 | #15 | Exceptional 30.0% |