Icelander vs Immigrants from Sri Lanka Currently Married
COMPARE
Icelander
Immigrants from Sri Lanka
Currently Married
Currently Married Comparison
Icelanders
Immigrants from Sri Lanka
47.3%
CURRENTLY MARRIED
82.4/ 100
METRIC RATING
131st/ 347
METRIC RANK
48.1%
CURRENTLY MARRIED
96.9/ 100
METRIC RATING
81st/ 347
METRIC RANK
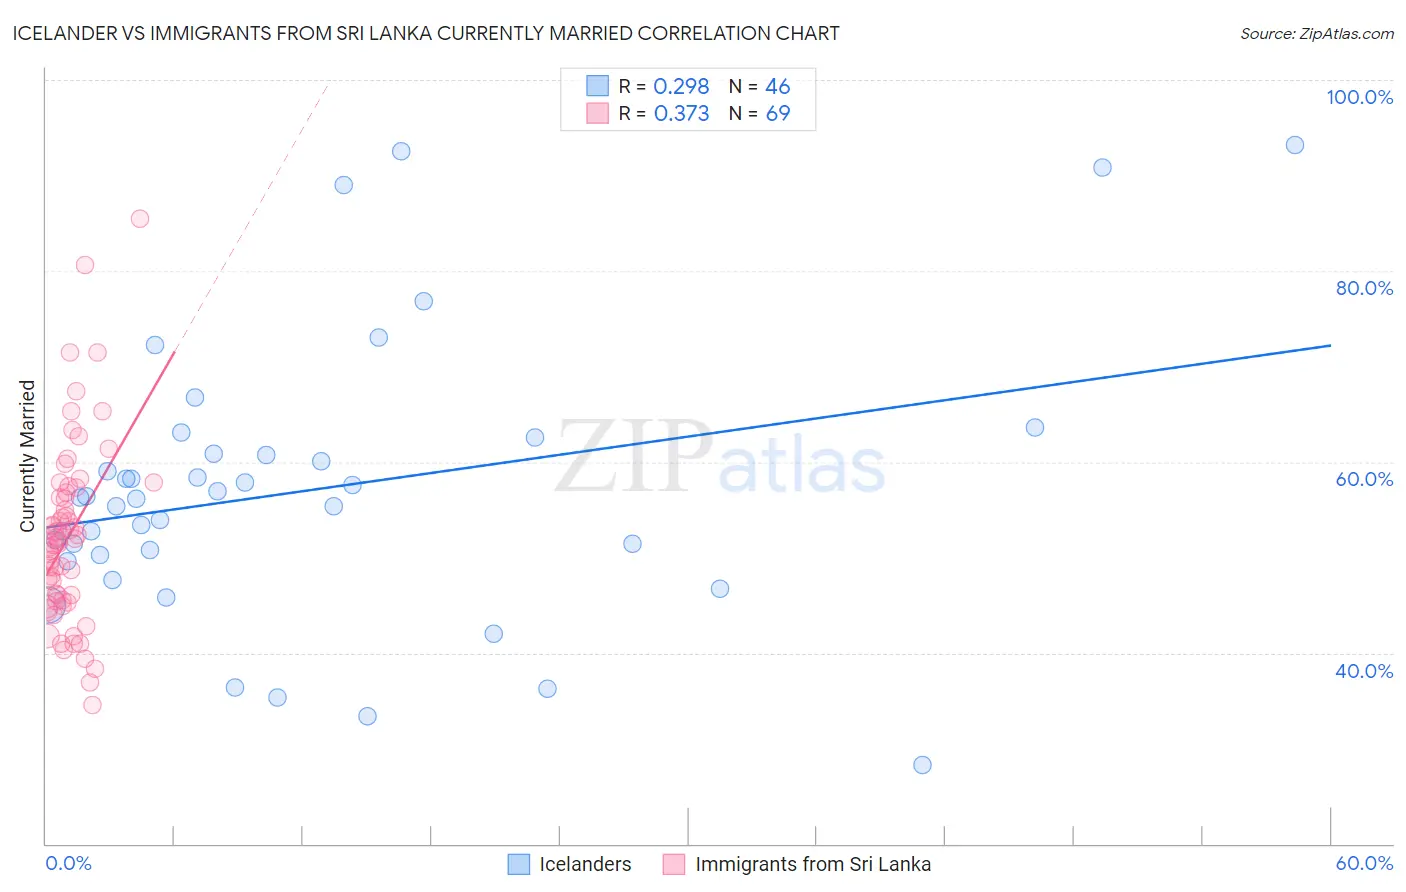
Icelander vs Immigrants from Sri Lanka Currently Married Correlation Chart
The statistical analysis conducted on geographies consisting of 159,647,895 people shows a weak positive correlation between the proportion of Icelanders and percentage of population currently married in the United States with a correlation coefficient (R) of 0.298 and weighted average of 47.3%. Similarly, the statistical analysis conducted on geographies consisting of 149,691,933 people shows a mild positive correlation between the proportion of Immigrants from Sri Lanka and percentage of population currently married in the United States with a correlation coefficient (R) of 0.373 and weighted average of 48.1%, a difference of 1.7%.
Currently Married Correlation Summary
| Measurement | Icelander | Immigrants from Sri Lanka |
| Minimum | 28.3% | 34.5% |
| Maximum | 93.2% | 85.5% |
| Range | 64.9% | 51.0% |
| Mean | 57.1% | 52.2% |
| Median | 56.2% | 51.7% |
| Interquartile 25% (IQ1) | 50.3% | 45.5% |
| Interquartile 75% (IQ3) | 60.9% | 57.1% |
| Interquartile Range (IQR) | 10.6% | 11.6% |
| Standard Deviation (Sample) | 14.6% | 9.6% |
| Standard Deviation (Population) | 14.4% | 9.5% |
Similar Demographics by Currently Married
Demographics Similar to Icelanders by Currently Married
In terms of currently married, the demographic groups most similar to Icelanders are Immigrants from Iraq (47.3%, a difference of 0.020%), Afghan (47.3%, a difference of 0.040%), Sri Lankan (47.3%, a difference of 0.050%), Immigrants from Malaysia (47.3%, a difference of 0.080%), and Immigrants from Australia (47.3%, a difference of 0.080%).
| Demographics | Rating | Rank | Currently Married |
| Laotians | 86.6 /100 | #124 | Excellent 47.4% |
| Okinawans | 85.3 /100 | #125 | Excellent 47.4% |
| Immigrants | Jordan | 84.9 /100 | #126 | Excellent 47.4% |
| New Zealanders | 84.9 /100 | #127 | Excellent 47.4% |
| Portuguese | 84.2 /100 | #128 | Excellent 47.3% |
| Sri Lankans | 83.2 /100 | #129 | Excellent 47.3% |
| Immigrants | Iraq | 82.8 /100 | #130 | Excellent 47.3% |
| Icelanders | 82.4 /100 | #131 | Excellent 47.3% |
| Afghans | 81.8 /100 | #132 | Excellent 47.3% |
| Immigrants | Malaysia | 81.1 /100 | #133 | Excellent 47.3% |
| Immigrants | Australia | 81.1 /100 | #134 | Excellent 47.3% |
| Immigrants | Norway | 79.7 /100 | #135 | Good 47.2% |
| Immigrants | Vietnam | 78.2 /100 | #136 | Good 47.2% |
| Paraguayans | 77.8 /100 | #137 | Good 47.2% |
| Pakistanis | 77.5 /100 | #138 | Good 47.2% |
Demographics Similar to Immigrants from Sri Lanka by Currently Married
In terms of currently married, the demographic groups most similar to Immigrants from Sri Lanka are Immigrants from Europe (48.1%, a difference of 0.0%), Immigrants from Poland (48.1%, a difference of 0.010%), Bolivian (48.1%, a difference of 0.010%), Immigrants from Israel (48.1%, a difference of 0.010%), and Immigrants from South Africa (48.1%, a difference of 0.040%).
| Demographics | Rating | Rank | Currently Married |
| Estonians | 97.4 /100 | #74 | Exceptional 48.2% |
| Immigrants | Belarus | 97.2 /100 | #75 | Exceptional 48.1% |
| Basques | 97.2 /100 | #76 | Exceptional 48.1% |
| Slovenes | 97.1 /100 | #77 | Exceptional 48.1% |
| Immigrants | Belgium | 97.1 /100 | #78 | Exceptional 48.1% |
| Immigrants | South Africa | 97.0 /100 | #79 | Exceptional 48.1% |
| Immigrants | Poland | 96.9 /100 | #80 | Exceptional 48.1% |
| Immigrants | Sri Lanka | 96.9 /100 | #81 | Exceptional 48.1% |
| Immigrants | Europe | 96.9 /100 | #82 | Exceptional 48.1% |
| Bolivians | 96.9 /100 | #83 | Exceptional 48.1% |
| Immigrants | Israel | 96.9 /100 | #84 | Exceptional 48.1% |
| French Canadians | 96.3 /100 | #85 | Exceptional 48.0% |
| Immigrants | Japan | 96.2 /100 | #86 | Exceptional 48.0% |
| Jordanians | 96.2 /100 | #87 | Exceptional 48.0% |
| Immigrants | Eastern Europe | 96.1 /100 | #88 | Exceptional 48.0% |