Hungarian vs Welsh Family Households with Children
COMPARE
Hungarian
Welsh
Family Households with Children
Family Households with Children Comparison
Hungarians
Welsh
27.6%
FAMILY HOUSEHOLDS WITH CHILDREN
74.6/ 100
METRIC RATING
156th/ 347
METRIC RANK
27.2%
FAMILY HOUSEHOLDS WITH CHILDREN
14.2/ 100
METRIC RATING
211th/ 347
METRIC RANK
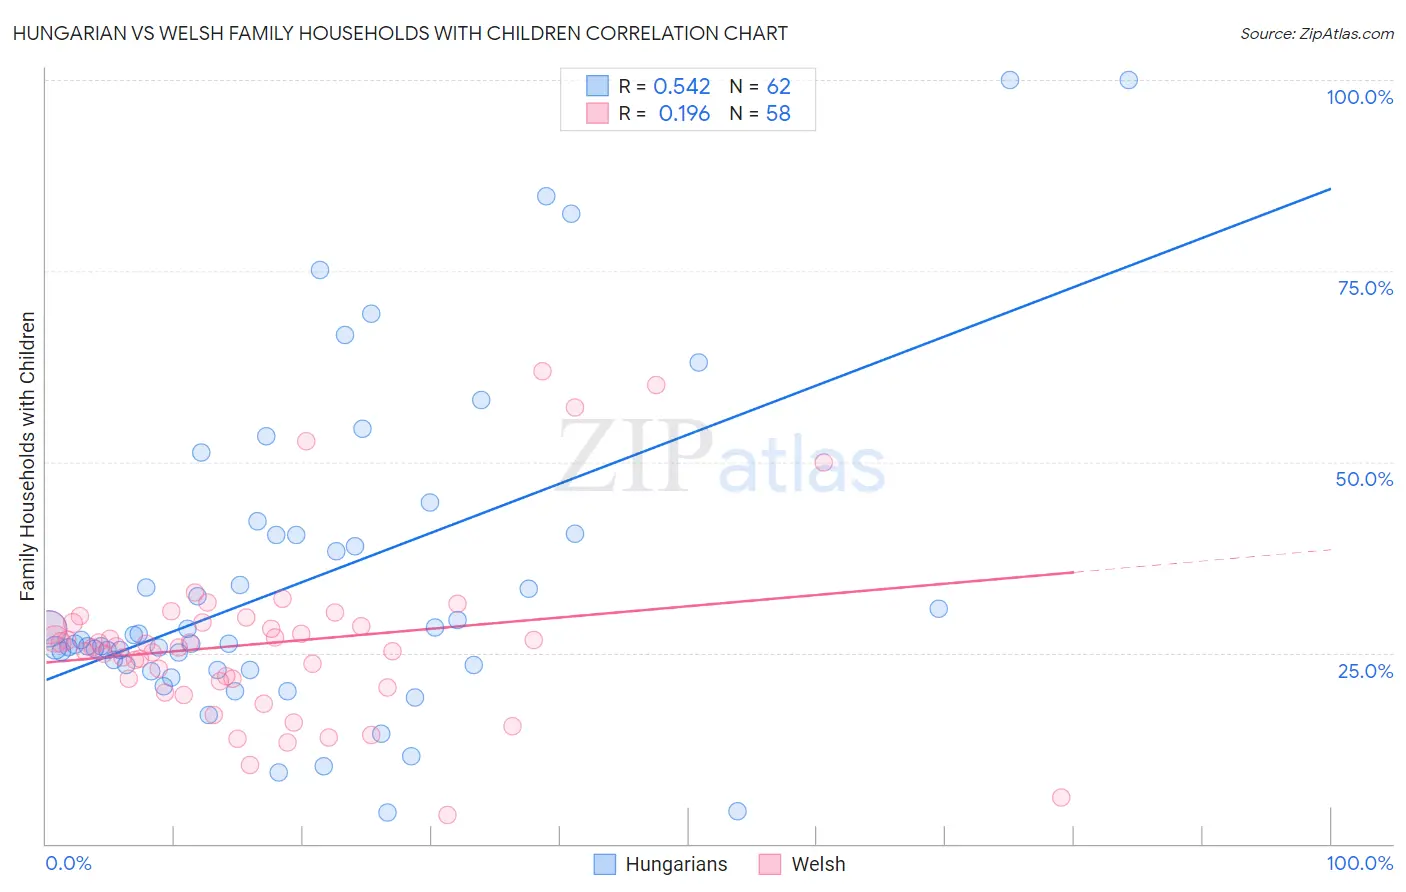
Hungarian vs Welsh Family Households with Children Correlation Chart
The statistical analysis conducted on geographies consisting of 485,629,585 people shows a substantial positive correlation between the proportion of Hungarians and percentage of family households with children in the United States with a correlation coefficient (R) of 0.542 and weighted average of 27.6%. Similarly, the statistical analysis conducted on geographies consisting of 527,895,960 people shows a poor positive correlation between the proportion of Welsh and percentage of family households with children in the United States with a correlation coefficient (R) of 0.196 and weighted average of 27.2%, a difference of 1.6%.
Family Households with Children Correlation Summary
| Measurement | Hungarian | Welsh |
| Minimum | 4.2% | 3.8% |
| Maximum | 100.0% | 61.8% |
| Range | 95.8% | 58.0% |
| Mean | 34.7% | 26.3% |
| Median | 26.5% | 25.8% |
| Interquartile 25% (IQ1) | 23.3% | 21.2% |
| Interquartile 75% (IQ3) | 40.4% | 28.9% |
| Interquartile Range (IQR) | 17.1% | 7.7% |
| Standard Deviation (Sample) | 21.2% | 11.3% |
| Standard Deviation (Population) | 21.0% | 11.2% |
Similar Demographics by Family Households with Children
Demographics Similar to Hungarians by Family Households with Children
In terms of family households with children, the demographic groups most similar to Hungarians are Comanche (27.6%, a difference of 0.010%), Icelander (27.6%, a difference of 0.020%), Immigrants from Cabo Verde (27.6%, a difference of 0.030%), Ethiopian (27.6%, a difference of 0.070%), and Indian (Asian) (27.6%, a difference of 0.080%).
| Demographics | Rating | Rank | Family Households with Children |
| Menominee | 78.9 /100 | #149 | Good 27.6% |
| Argentineans | 78.5 /100 | #150 | Good 27.6% |
| Portuguese | 77.8 /100 | #151 | Good 27.6% |
| Ethiopians | 77.0 /100 | #152 | Good 27.6% |
| Immigrants | Cabo Verde | 75.6 /100 | #153 | Good 27.6% |
| Icelanders | 75.3 /100 | #154 | Good 27.6% |
| Comanche | 74.8 /100 | #155 | Good 27.6% |
| Hungarians | 74.6 /100 | #156 | Good 27.6% |
| Indians (Asian) | 71.6 /100 | #157 | Good 27.6% |
| Romanians | 70.8 /100 | #158 | Good 27.6% |
| Mongolians | 70.7 /100 | #159 | Good 27.6% |
| Sub-Saharan Africans | 67.5 /100 | #160 | Good 27.6% |
| Alaskan Athabascans | 67.1 /100 | #161 | Good 27.6% |
| Immigrants | Bangladesh | 67.0 /100 | #162 | Good 27.6% |
| Czechs | 65.3 /100 | #163 | Good 27.5% |
Demographics Similar to Welsh by Family Households with Children
In terms of family households with children, the demographic groups most similar to Welsh are Immigrants from Ukraine (27.2%, a difference of 0.010%), Immigrants from Dominica (27.2%, a difference of 0.010%), Okinawan (27.2%, a difference of 0.020%), African (27.2%, a difference of 0.060%), and Northern European (27.2%, a difference of 0.060%).
| Demographics | Rating | Rank | Family Households with Children |
| Immigrants | Sudan | 21.6 /100 | #204 | Fair 27.3% |
| Immigrants | Haiti | 20.3 /100 | #205 | Fair 27.2% |
| Immigrants | Micronesia | 20.2 /100 | #206 | Fair 27.2% |
| Haitians | 19.8 /100 | #207 | Poor 27.2% |
| Immigrants | Poland | 16.4 /100 | #208 | Poor 27.2% |
| Dutch West Indians | 15.8 /100 | #209 | Poor 27.2% |
| Immigrants | Ukraine | 14.4 /100 | #210 | Poor 27.2% |
| Welsh | 14.2 /100 | #211 | Poor 27.2% |
| Immigrants | Dominica | 13.9 /100 | #212 | Poor 27.2% |
| Okinawans | 13.7 /100 | #213 | Poor 27.2% |
| Africans | 13.0 /100 | #214 | Poor 27.2% |
| Northern Europeans | 12.8 /100 | #215 | Poor 27.2% |
| Cubans | 12.2 /100 | #216 | Poor 27.1% |
| U.S. Virgin Islanders | 12.1 /100 | #217 | Poor 27.1% |
| Greeks | 11.4 /100 | #218 | Poor 27.1% |