Hungarian vs Immigrants from Uzbekistan Family Households with Children
COMPARE
Hungarian
Immigrants from Uzbekistan
Family Households with Children
Family Households with Children Comparison
Hungarians
Immigrants from Uzbekistan
27.6%
FAMILY HOUSEHOLDS WITH CHILDREN
74.6/ 100
METRIC RATING
156th/ 347
METRIC RANK
26.7%
FAMILY HOUSEHOLDS WITH CHILDREN
0.9/ 100
METRIC RATING
267th/ 347
METRIC RANK
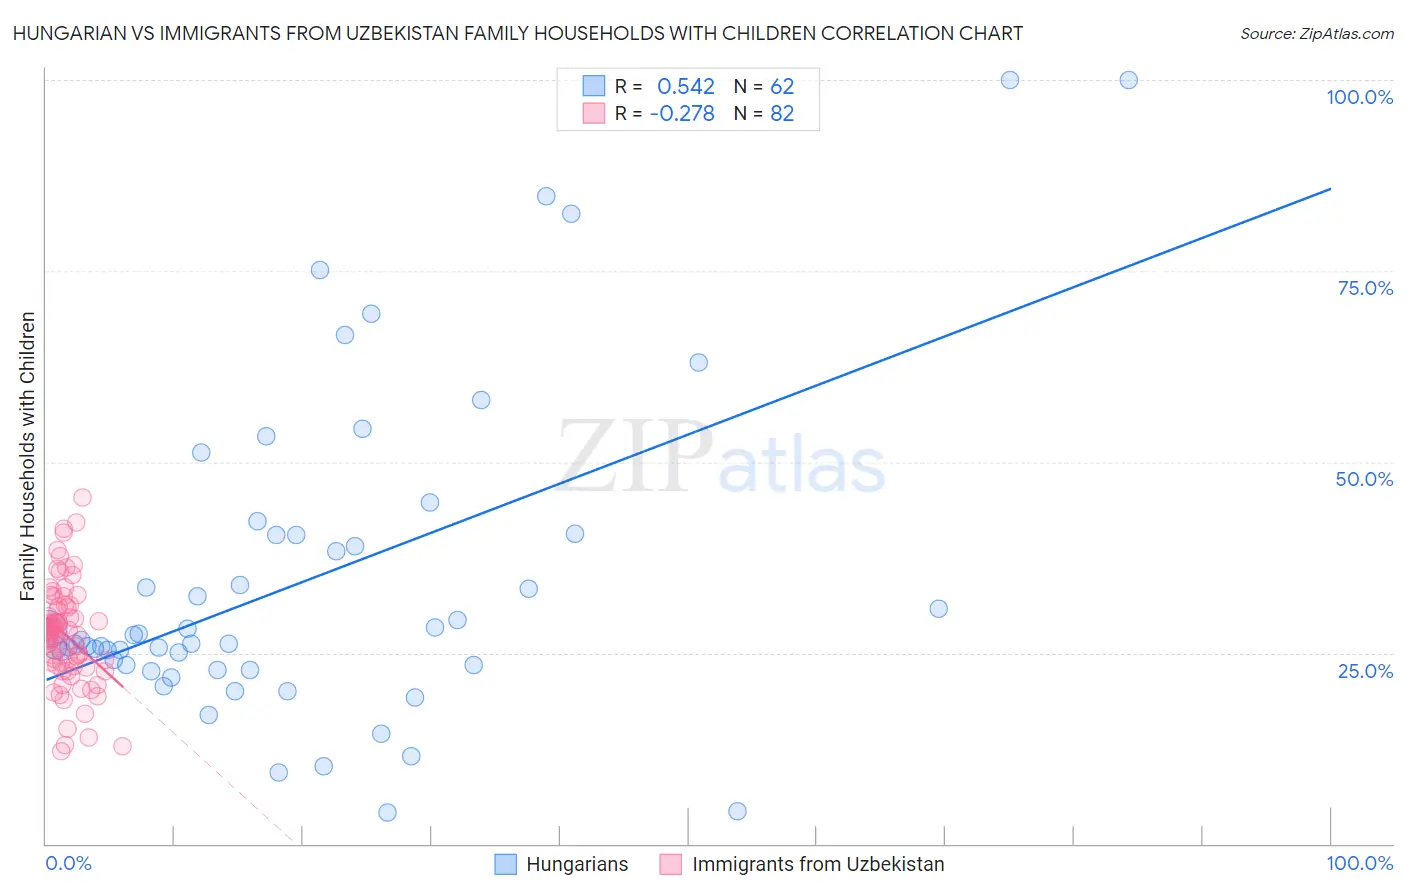
Hungarian vs Immigrants from Uzbekistan Family Households with Children Correlation Chart
The statistical analysis conducted on geographies consisting of 485,629,585 people shows a substantial positive correlation between the proportion of Hungarians and percentage of family households with children in the United States with a correlation coefficient (R) of 0.542 and weighted average of 27.6%. Similarly, the statistical analysis conducted on geographies consisting of 118,662,490 people shows a weak negative correlation between the proportion of Immigrants from Uzbekistan and percentage of family households with children in the United States with a correlation coefficient (R) of -0.278 and weighted average of 26.7%, a difference of 3.3%.
Family Households with Children Correlation Summary
| Measurement | Hungarian | Immigrants from Uzbekistan |
| Minimum | 4.2% | 12.1% |
| Maximum | 100.0% | 45.4% |
| Range | 95.8% | 33.3% |
| Mean | 34.7% | 27.3% |
| Median | 26.5% | 27.5% |
| Interquartile 25% (IQ1) | 23.3% | 23.4% |
| Interquartile 75% (IQ3) | 40.4% | 31.1% |
| Interquartile Range (IQR) | 17.1% | 7.7% |
| Standard Deviation (Sample) | 21.2% | 6.7% |
| Standard Deviation (Population) | 21.0% | 6.6% |
Similar Demographics by Family Households with Children
Demographics Similar to Hungarians by Family Households with Children
In terms of family households with children, the demographic groups most similar to Hungarians are Comanche (27.6%, a difference of 0.010%), Icelander (27.6%, a difference of 0.020%), Immigrants from Cabo Verde (27.6%, a difference of 0.030%), Ethiopian (27.6%, a difference of 0.070%), and Indian (Asian) (27.6%, a difference of 0.080%).
| Demographics | Rating | Rank | Family Households with Children |
| Menominee | 78.9 /100 | #149 | Good 27.6% |
| Argentineans | 78.5 /100 | #150 | Good 27.6% |
| Portuguese | 77.8 /100 | #151 | Good 27.6% |
| Ethiopians | 77.0 /100 | #152 | Good 27.6% |
| Immigrants | Cabo Verde | 75.6 /100 | #153 | Good 27.6% |
| Icelanders | 75.3 /100 | #154 | Good 27.6% |
| Comanche | 74.8 /100 | #155 | Good 27.6% |
| Hungarians | 74.6 /100 | #156 | Good 27.6% |
| Indians (Asian) | 71.6 /100 | #157 | Good 27.6% |
| Romanians | 70.8 /100 | #158 | Good 27.6% |
| Mongolians | 70.7 /100 | #159 | Good 27.6% |
| Sub-Saharan Africans | 67.5 /100 | #160 | Good 27.6% |
| Alaskan Athabascans | 67.1 /100 | #161 | Good 27.6% |
| Immigrants | Bangladesh | 67.0 /100 | #162 | Good 27.6% |
| Czechs | 65.3 /100 | #163 | Good 27.5% |
Demographics Similar to Immigrants from Uzbekistan by Family Households with Children
In terms of family households with children, the demographic groups most similar to Immigrants from Uzbekistan are Maltese (26.7%, a difference of 0.0%), Taiwanese (26.7%, a difference of 0.010%), Chippewa (26.7%, a difference of 0.010%), Immigrants from Belgium (26.7%, a difference of 0.010%), and Immigrants from Russia (26.8%, a difference of 0.050%).
| Demographics | Rating | Rank | Family Households with Children |
| Immigrants | Jamaica | 1.2 /100 | #260 | Tragic 26.8% |
| Immigrants | Belarus | 1.1 /100 | #261 | Tragic 26.8% |
| Immigrants | Russia | 1.0 /100 | #262 | Tragic 26.8% |
| Immigrants | North Macedonia | 1.0 /100 | #263 | Tragic 26.7% |
| Taiwanese | 0.9 /100 | #264 | Tragic 26.7% |
| Chippewa | 0.9 /100 | #265 | Tragic 26.7% |
| Maltese | 0.9 /100 | #266 | Tragic 26.7% |
| Immigrants | Uzbekistan | 0.9 /100 | #267 | Tragic 26.7% |
| Immigrants | Belgium | 0.9 /100 | #268 | Tragic 26.7% |
| Immigrants | Denmark | 0.8 /100 | #269 | Tragic 26.7% |
| Immigrants | Zaire | 0.7 /100 | #270 | Tragic 26.7% |
| French | 0.7 /100 | #271 | Tragic 26.7% |
| Somalis | 0.7 /100 | #272 | Tragic 26.7% |
| Immigrants | Hungary | 0.6 /100 | #273 | Tragic 26.7% |
| Eastern Europeans | 0.6 /100 | #274 | Tragic 26.7% |