Immigrants from Senegal vs Immigrants from Uzbekistan Family Households with Children
COMPARE
Immigrants from Senegal
Immigrants from Uzbekistan
Family Households with Children
Family Households with Children Comparison
Immigrants from Senegal
Immigrants from Uzbekistan
26.5%
FAMILY HOUSEHOLDS WITH CHILDREN
0.2/ 100
METRIC RATING
286th/ 347
METRIC RANK
26.7%
FAMILY HOUSEHOLDS WITH CHILDREN
0.9/ 100
METRIC RATING
267th/ 347
METRIC RANK
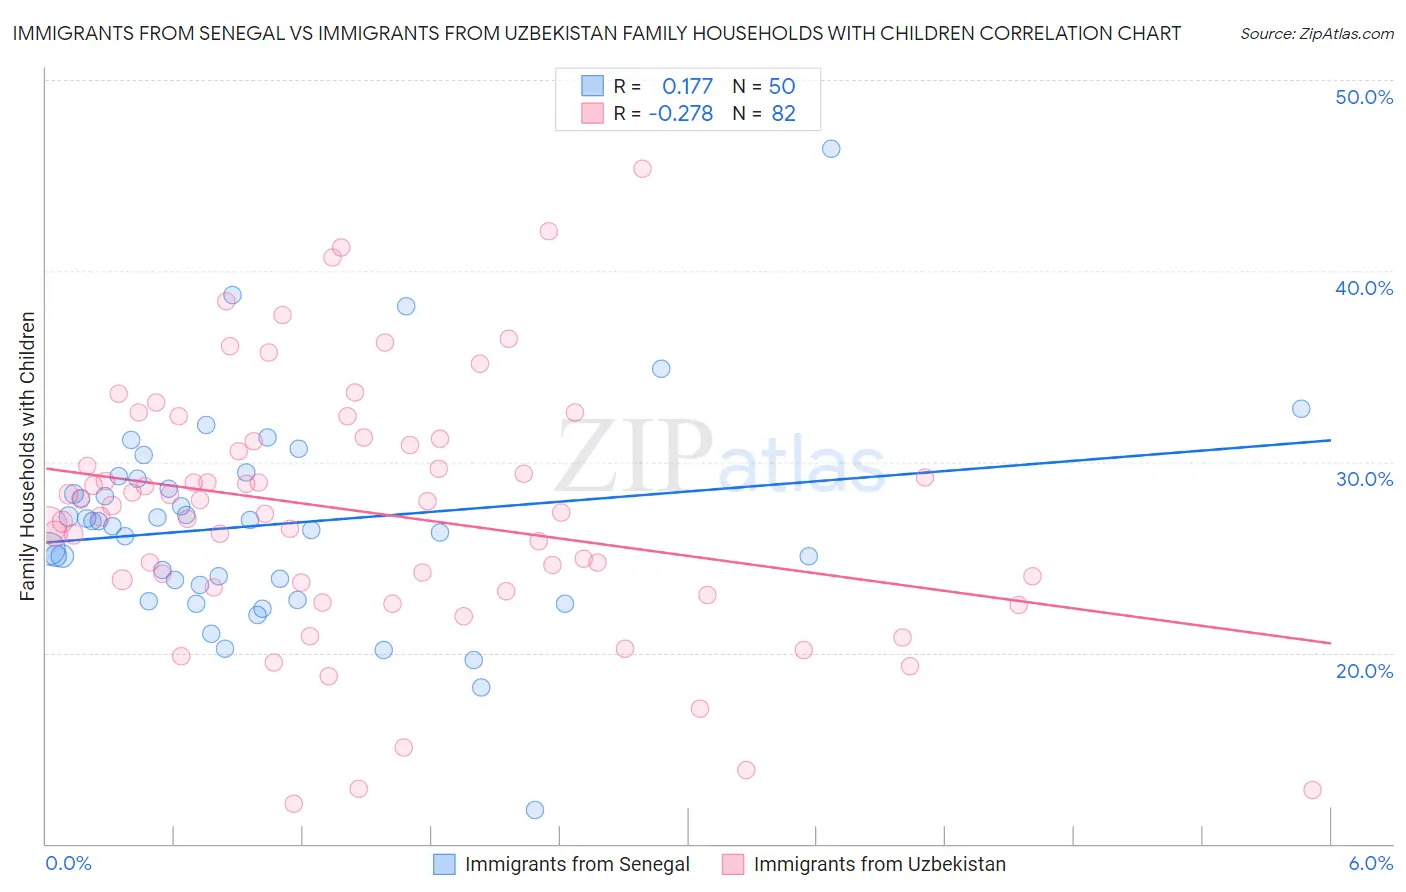
Immigrants from Senegal vs Immigrants from Uzbekistan Family Households with Children Correlation Chart
The statistical analysis conducted on geographies consisting of 90,108,682 people shows a poor positive correlation between the proportion of Immigrants from Senegal and percentage of family households with children in the United States with a correlation coefficient (R) of 0.177 and weighted average of 26.5%. Similarly, the statistical analysis conducted on geographies consisting of 118,662,490 people shows a weak negative correlation between the proportion of Immigrants from Uzbekistan and percentage of family households with children in the United States with a correlation coefficient (R) of -0.278 and weighted average of 26.7%, a difference of 0.79%.
Family Households with Children Correlation Summary
| Measurement | Immigrants from Senegal | Immigrants from Uzbekistan |
| Minimum | 11.8% | 12.1% |
| Maximum | 46.4% | 45.4% |
| Range | 34.6% | 33.3% |
| Mean | 26.7% | 27.3% |
| Median | 26.8% | 27.5% |
| Interquartile 25% (IQ1) | 23.6% | 23.4% |
| Interquartile 75% (IQ3) | 29.1% | 31.1% |
| Interquartile Range (IQR) | 5.6% | 7.7% |
| Standard Deviation (Sample) | 5.6% | 6.7% |
| Standard Deviation (Population) | 5.5% | 6.6% |
Demographics Similar to Immigrants from Senegal and Immigrants from Uzbekistan by Family Households with Children
In terms of family households with children, the demographic groups most similar to Immigrants from Senegal are Cambodian (26.5%, a difference of 0.050%), Immigrants from Canada (26.5%, a difference of 0.080%), Immigrants from North America (26.6%, a difference of 0.10%), French American Indian (26.6%, a difference of 0.17%), and Lithuanian (26.6%, a difference of 0.18%). Similarly, the demographic groups most similar to Immigrants from Uzbekistan are Maltese (26.7%, a difference of 0.0%), Immigrants from Belgium (26.7%, a difference of 0.010%), Immigrants from Denmark (26.7%, a difference of 0.050%), Immigrants from Zaire (26.7%, a difference of 0.11%), and French (26.7%, a difference of 0.12%).
| Demographics | Rating | Rank | Family Households with Children |
| Maltese | 0.9 /100 | #266 | Tragic 26.7% |
| Immigrants | Uzbekistan | 0.9 /100 | #267 | Tragic 26.7% |
| Immigrants | Belgium | 0.9 /100 | #268 | Tragic 26.7% |
| Immigrants | Denmark | 0.8 /100 | #269 | Tragic 26.7% |
| Immigrants | Zaire | 0.7 /100 | #270 | Tragic 26.7% |
| French | 0.7 /100 | #271 | Tragic 26.7% |
| Somalis | 0.7 /100 | #272 | Tragic 26.7% |
| Immigrants | Hungary | 0.6 /100 | #273 | Tragic 26.7% |
| Eastern Europeans | 0.6 /100 | #274 | Tragic 26.7% |
| Immigrants | Northern Europe | 0.5 /100 | #275 | Tragic 26.7% |
| Immigrants | Spain | 0.5 /100 | #276 | Tragic 26.6% |
| Celtics | 0.4 /100 | #277 | Tragic 26.6% |
| Immigrants | Europe | 0.4 /100 | #278 | Tragic 26.6% |
| Finns | 0.4 /100 | #279 | Tragic 26.6% |
| Senegalese | 0.4 /100 | #280 | Tragic 26.6% |
| Lithuanians | 0.3 /100 | #281 | Tragic 26.6% |
| French American Indians | 0.3 /100 | #282 | Tragic 26.6% |
| Immigrants | North America | 0.3 /100 | #283 | Tragic 26.6% |
| Immigrants | Canada | 0.3 /100 | #284 | Tragic 26.5% |
| Cambodians | 0.2 /100 | #285 | Tragic 26.5% |
| Immigrants | Senegal | 0.2 /100 | #286 | Tragic 26.5% |