Hawaiian vs Honduran Divorced or Separated
COMPARE
Hawaiian
Honduran
Divorced or Separated
Divorced or Separated Comparison
Hawaiians
Hondurans
12.1%
DIVORCED OR SEPARATED
50.0/ 100
METRIC RATING
174th/ 347
METRIC RANK
12.8%
DIVORCED OR SEPARATED
0.1/ 100
METRIC RATING
287th/ 347
METRIC RANK
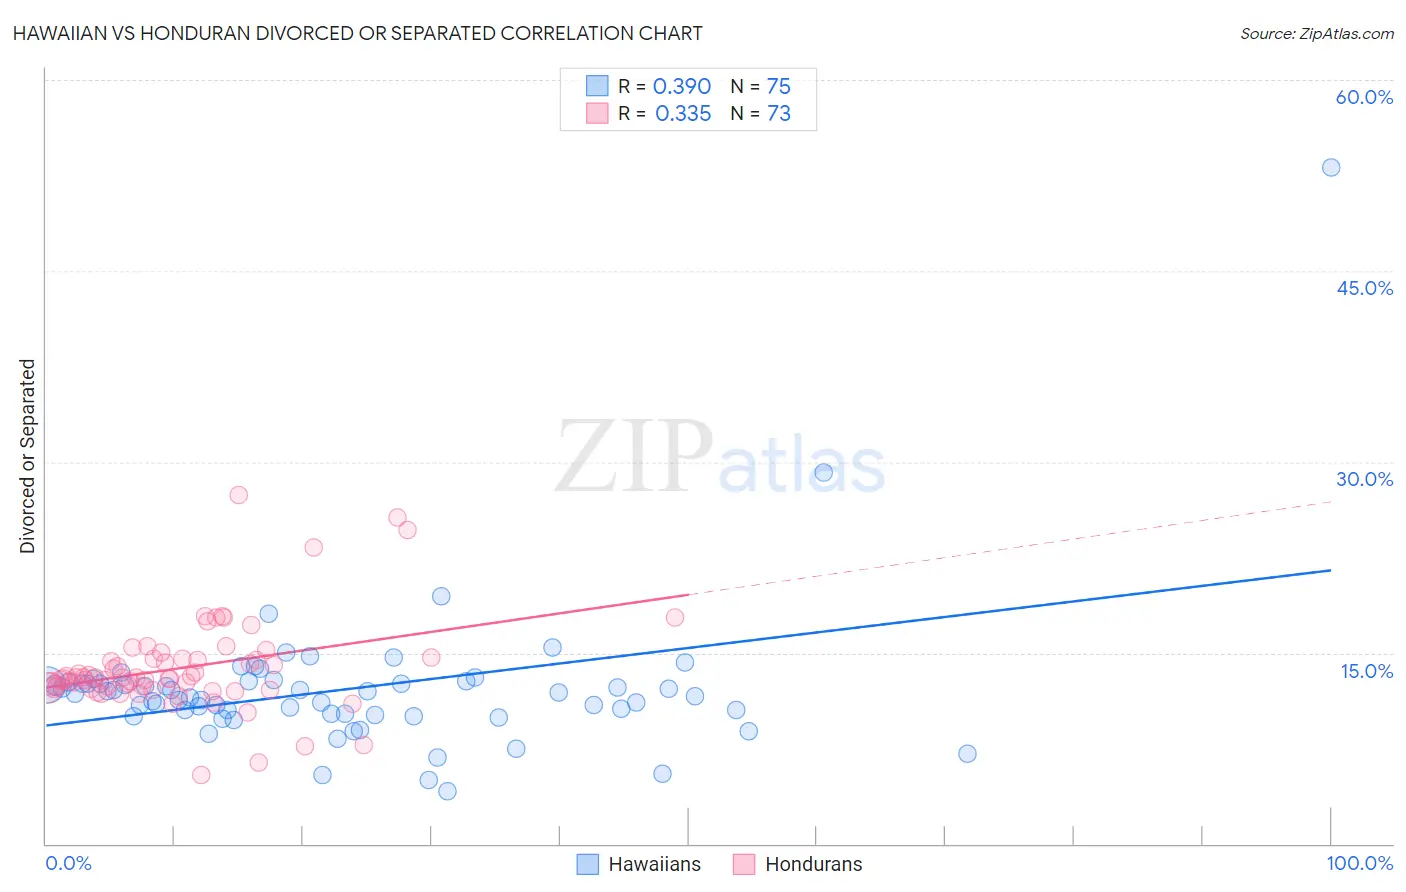
Hawaiian vs Honduran Divorced or Separated Correlation Chart
The statistical analysis conducted on geographies consisting of 327,516,248 people shows a mild positive correlation between the proportion of Hawaiians and percentage of population currently divorced or separated in the United States with a correlation coefficient (R) of 0.390 and weighted average of 12.1%. Similarly, the statistical analysis conducted on geographies consisting of 357,724,421 people shows a mild positive correlation between the proportion of Hondurans and percentage of population currently divorced or separated in the United States with a correlation coefficient (R) of 0.335 and weighted average of 12.8%, a difference of 6.2%.
Divorced or Separated Correlation Summary
| Measurement | Hawaiian | Honduran |
| Minimum | 4.1% | 5.4% |
| Maximum | 53.1% | 27.4% |
| Range | 49.0% | 22.0% |
| Mean | 12.1% | 13.8% |
| Median | 11.8% | 13.0% |
| Interquartile 25% (IQ1) | 10.2% | 12.2% |
| Interquartile 75% (IQ3) | 12.7% | 14.5% |
| Interquartile Range (IQR) | 2.5% | 2.3% |
| Standard Deviation (Sample) | 5.8% | 3.6% |
| Standard Deviation (Population) | 5.8% | 3.6% |
Similar Demographics by Divorced or Separated
Demographics Similar to Hawaiians by Divorced or Separated
In terms of divorced or separated, the demographic groups most similar to Hawaiians are Immigrants from Sierra Leone (12.1%, a difference of 0.0%), Immigrants from Moldova (12.1%, a difference of 0.020%), Pennsylvania German (12.1%, a difference of 0.040%), Brazilian (12.1%, a difference of 0.080%), and Immigrants from Mexico (12.0%, a difference of 0.11%).
| Demographics | Rating | Rank | Divorced or Separated |
| Ethiopians | 58.5 /100 | #167 | Average 12.0% |
| Serbians | 57.1 /100 | #168 | Average 12.0% |
| Immigrants | Peru | 57.0 /100 | #169 | Average 12.0% |
| Mexican American Indians | 55.8 /100 | #170 | Average 12.0% |
| Costa Ricans | 53.3 /100 | #171 | Average 12.0% |
| Immigrants | Mexico | 53.2 /100 | #172 | Average 12.0% |
| Immigrants | Moldova | 50.4 /100 | #173 | Average 12.1% |
| Hawaiians | 50.0 /100 | #174 | Average 12.1% |
| Immigrants | Sierra Leone | 50.0 /100 | #175 | Average 12.1% |
| Pennsylvania Germans | 48.9 /100 | #176 | Average 12.1% |
| Brazilians | 47.7 /100 | #177 | Average 12.1% |
| Ghanaians | 45.9 /100 | #178 | Average 12.1% |
| Immigrants | Western Europe | 45.6 /100 | #179 | Average 12.1% |
| Barbadians | 45.0 /100 | #180 | Average 12.1% |
| Immigrants | Canada | 44.0 /100 | #181 | Average 12.1% |
Demographics Similar to Hondurans by Divorced or Separated
In terms of divorced or separated, the demographic groups most similar to Hondurans are Spanish (12.8%, a difference of 0.19%), French Canadian (12.8%, a difference of 0.26%), French (12.8%, a difference of 0.41%), Iroquois (12.9%, a difference of 0.41%), and Nonimmigrants (12.8%, a difference of 0.45%).
| Demographics | Rating | Rank | Divorced or Separated |
| Immigrants | Zaire | 0.2 /100 | #280 | Tragic 12.7% |
| Pueblo | 0.2 /100 | #281 | Tragic 12.7% |
| Sub-Saharan Africans | 0.1 /100 | #282 | Tragic 12.7% |
| Delaware | 0.1 /100 | #283 | Tragic 12.7% |
| Immigrants | Nonimmigrants | 0.1 /100 | #284 | Tragic 12.8% |
| French | 0.1 /100 | #285 | Tragic 12.8% |
| Spanish | 0.1 /100 | #286 | Tragic 12.8% |
| Hondurans | 0.1 /100 | #287 | Tragic 12.8% |
| French Canadians | 0.1 /100 | #288 | Tragic 12.8% |
| Iroquois | 0.0 /100 | #289 | Tragic 12.9% |
| Pima | 0.0 /100 | #290 | Tragic 12.9% |
| Immigrants | Honduras | 0.0 /100 | #291 | Tragic 12.9% |
| Scotch-Irish | 0.0 /100 | #292 | Tragic 12.9% |
| Jamaicans | 0.0 /100 | #293 | Tragic 12.9% |
| Apache | 0.0 /100 | #294 | Tragic 12.9% |