Burmese vs Honduran Divorced or Separated
COMPARE
Burmese
Honduran
Divorced or Separated
Divorced or Separated Comparison
Burmese
Hondurans
10.7%
DIVORCED OR SEPARATED
100.0/ 100
METRIC RATING
20th/ 347
METRIC RANK
12.8%
DIVORCED OR SEPARATED
0.1/ 100
METRIC RATING
287th/ 347
METRIC RANK
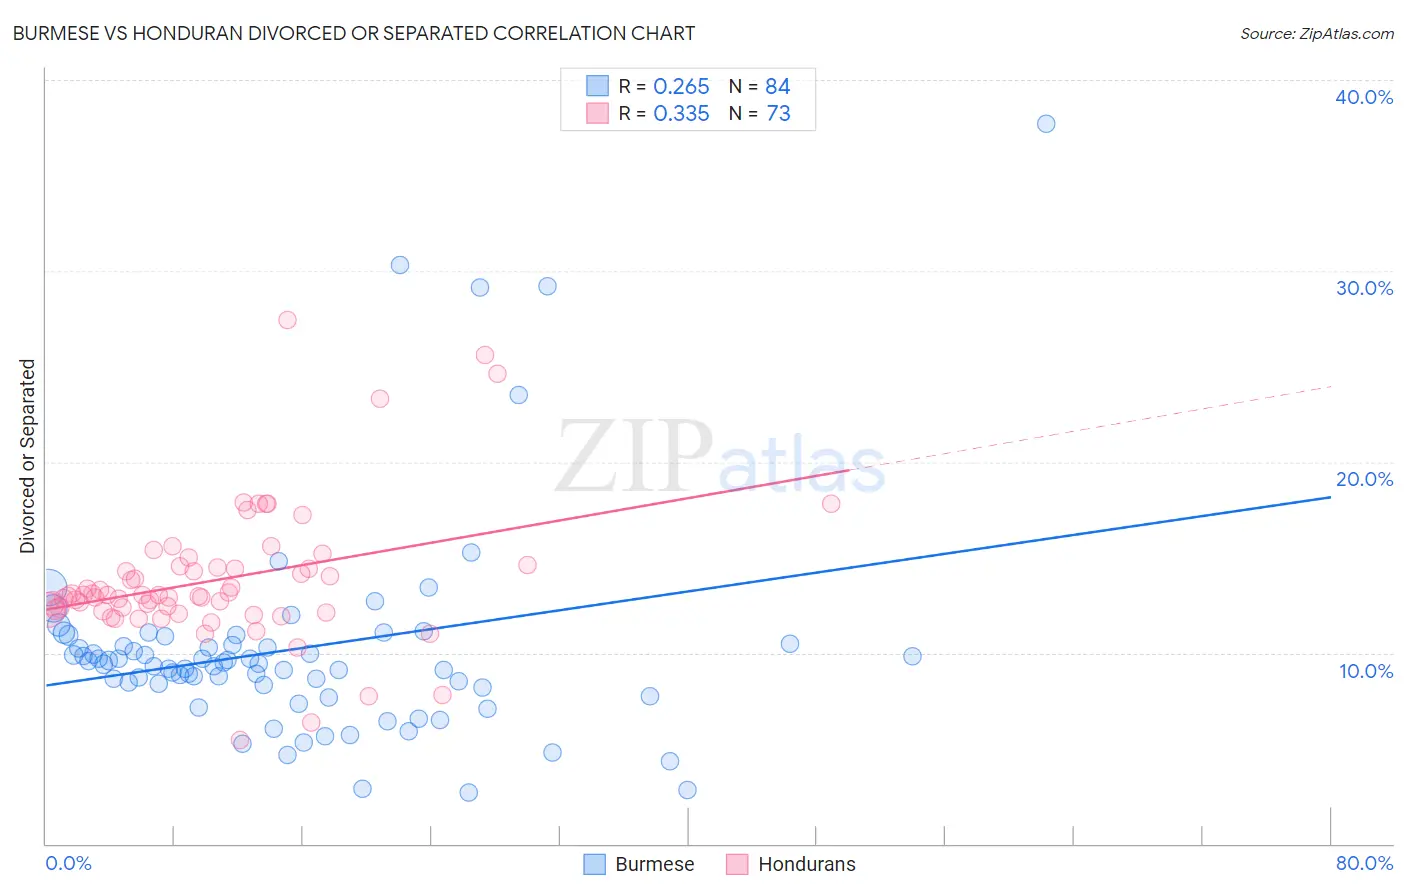
Burmese vs Honduran Divorced or Separated Correlation Chart
The statistical analysis conducted on geographies consisting of 465,063,245 people shows a weak positive correlation between the proportion of Burmese and percentage of population currently divorced or separated in the United States with a correlation coefficient (R) of 0.265 and weighted average of 10.7%. Similarly, the statistical analysis conducted on geographies consisting of 357,724,421 people shows a mild positive correlation between the proportion of Hondurans and percentage of population currently divorced or separated in the United States with a correlation coefficient (R) of 0.335 and weighted average of 12.8%, a difference of 19.6%.
Divorced or Separated Correlation Summary
| Measurement | Burmese | Honduran |
| Minimum | 2.7% | 5.4% |
| Maximum | 37.7% | 27.4% |
| Range | 35.0% | 22.0% |
| Mean | 10.2% | 13.8% |
| Median | 9.4% | 13.0% |
| Interquartile 25% (IQ1) | 8.3% | 12.2% |
| Interquartile 75% (IQ3) | 10.4% | 14.5% |
| Interquartile Range (IQR) | 2.2% | 2.3% |
| Standard Deviation (Sample) | 5.7% | 3.6% |
| Standard Deviation (Population) | 5.6% | 3.6% |
Similar Demographics by Divorced or Separated
Demographics Similar to Burmese by Divorced or Separated
In terms of divorced or separated, the demographic groups most similar to Burmese are Immigrants from Asia (10.7%, a difference of 0.18%), Vietnamese (10.8%, a difference of 0.44%), Immigrants from Pakistan (10.8%, a difference of 0.62%), Immigrants from Iran (10.6%, a difference of 0.74%), and Asian (10.6%, a difference of 0.74%).
| Demographics | Rating | Rank | Divorced or Separated |
| Cypriots | 100.0 /100 | #13 | Exceptional 10.5% |
| Assyrians/Chaldeans/Syriacs | 100.0 /100 | #14 | Exceptional 10.6% |
| Immigrants | Armenia | 100.0 /100 | #15 | Exceptional 10.6% |
| Immigrants | Korea | 100.0 /100 | #16 | Exceptional 10.6% |
| Immigrants | Israel | 100.0 /100 | #17 | Exceptional 10.6% |
| Immigrants | Iran | 100.0 /100 | #18 | Exceptional 10.6% |
| Asians | 100.0 /100 | #19 | Exceptional 10.6% |
| Burmese | 100.0 /100 | #20 | Exceptional 10.7% |
| Immigrants | Asia | 100.0 /100 | #21 | Exceptional 10.7% |
| Vietnamese | 100.0 /100 | #22 | Exceptional 10.8% |
| Immigrants | Pakistan | 100.0 /100 | #23 | Exceptional 10.8% |
| Immigrants | Sri Lanka | 100.0 /100 | #24 | Exceptional 10.8% |
| Iranians | 100.0 /100 | #25 | Exceptional 10.8% |
| Immigrants | Indonesia | 100.0 /100 | #26 | Exceptional 10.9% |
| Immigrants | Bangladesh | 100.0 /100 | #27 | Exceptional 11.0% |
Demographics Similar to Hondurans by Divorced or Separated
In terms of divorced or separated, the demographic groups most similar to Hondurans are Spanish (12.8%, a difference of 0.19%), French Canadian (12.8%, a difference of 0.26%), French (12.8%, a difference of 0.41%), Iroquois (12.9%, a difference of 0.41%), and Nonimmigrants (12.8%, a difference of 0.45%).
| Demographics | Rating | Rank | Divorced or Separated |
| Immigrants | Zaire | 0.2 /100 | #280 | Tragic 12.7% |
| Pueblo | 0.2 /100 | #281 | Tragic 12.7% |
| Sub-Saharan Africans | 0.1 /100 | #282 | Tragic 12.7% |
| Delaware | 0.1 /100 | #283 | Tragic 12.7% |
| Immigrants | Nonimmigrants | 0.1 /100 | #284 | Tragic 12.8% |
| French | 0.1 /100 | #285 | Tragic 12.8% |
| Spanish | 0.1 /100 | #286 | Tragic 12.8% |
| Hondurans | 0.1 /100 | #287 | Tragic 12.8% |
| French Canadians | 0.1 /100 | #288 | Tragic 12.8% |
| Iroquois | 0.0 /100 | #289 | Tragic 12.9% |
| Pima | 0.0 /100 | #290 | Tragic 12.9% |
| Immigrants | Honduras | 0.0 /100 | #291 | Tragic 12.9% |
| Scotch-Irish | 0.0 /100 | #292 | Tragic 12.9% |
| Jamaicans | 0.0 /100 | #293 | Tragic 12.9% |
| Apache | 0.0 /100 | #294 | Tragic 12.9% |