German Russian vs Immigrants from Chile Married-couple Households
COMPARE
German Russian
Immigrants from Chile
Married-couple Households
Married-couple Households Comparison
German Russians
Immigrants from Chile
44.0%
MARRIED-COUPLE HOUSEHOLDS
0.4/ 100
METRIC RATING
251st/ 347
METRIC RANK
46.5%
MARRIED-COUPLE HOUSEHOLDS
55.7/ 100
METRIC RATING
171st/ 347
METRIC RANK
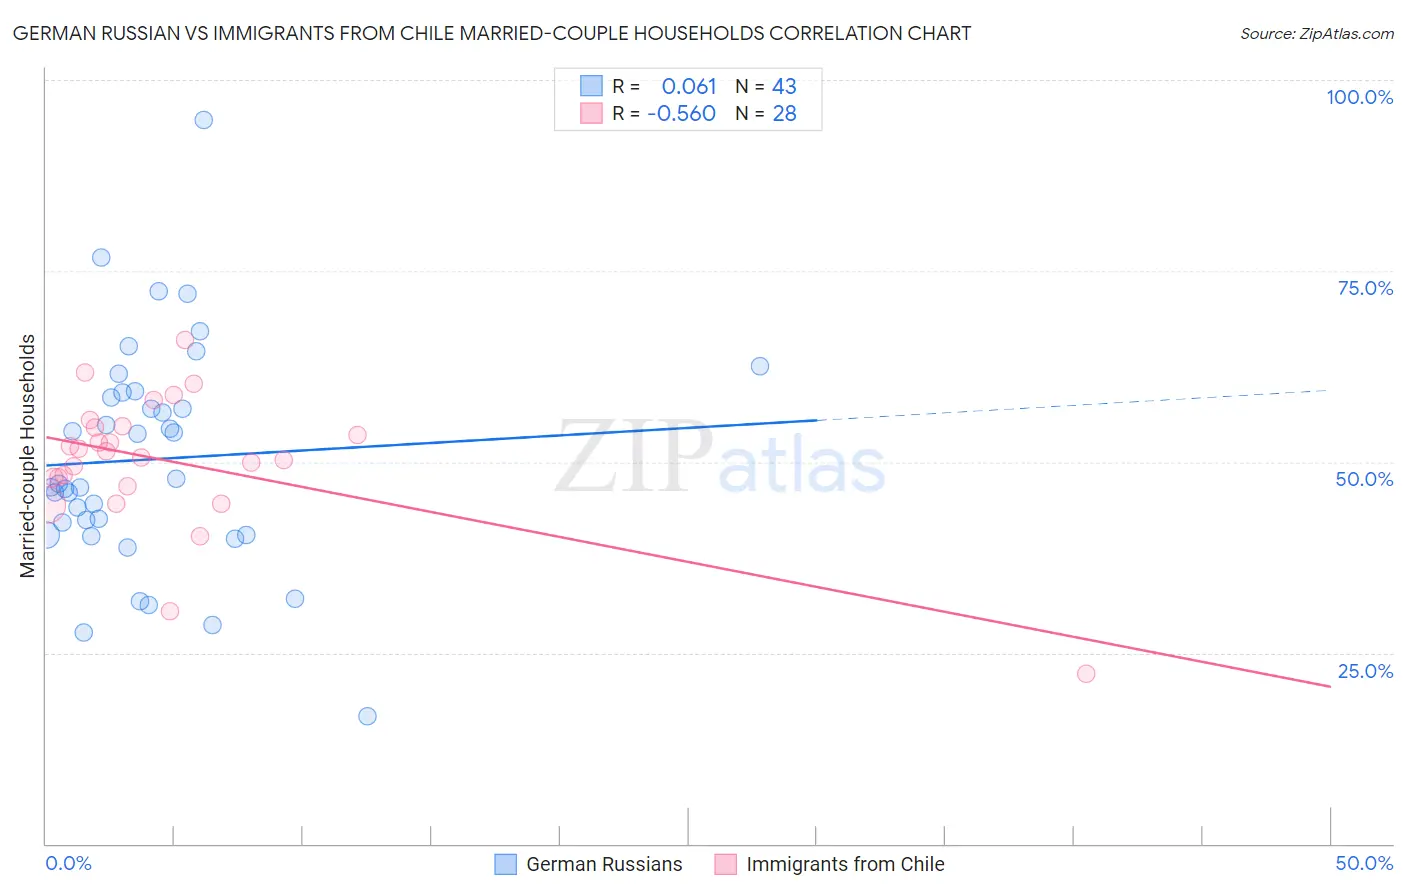
German Russian vs Immigrants from Chile Married-couple Households Correlation Chart
The statistical analysis conducted on geographies consisting of 96,451,375 people shows a slight positive correlation between the proportion of German Russians and percentage of married-couple family households in the United States with a correlation coefficient (R) of 0.061 and weighted average of 44.0%. Similarly, the statistical analysis conducted on geographies consisting of 218,594,724 people shows a substantial negative correlation between the proportion of Immigrants from Chile and percentage of married-couple family households in the United States with a correlation coefficient (R) of -0.560 and weighted average of 46.5%, a difference of 5.7%.
Married-couple Households Correlation Summary
| Measurement | German Russian | Immigrants from Chile |
| Minimum | 16.7% | 22.2% |
| Maximum | 94.7% | 65.9% |
| Range | 78.1% | 43.7% |
| Mean | 50.3% | 50.0% |
| Median | 47.1% | 51.0% |
| Interquartile 25% (IQ1) | 40.4% | 47.4% |
| Interquartile 75% (IQ3) | 59.0% | 54.6% |
| Interquartile Range (IQR) | 18.6% | 7.2% |
| Standard Deviation (Sample) | 14.7% | 8.8% |
| Standard Deviation (Population) | 14.5% | 8.7% |
Similar Demographics by Married-couple Households
Demographics Similar to German Russians by Married-couple Households
In terms of married-couple households, the demographic groups most similar to German Russians are Seminole (44.0%, a difference of 0.070%), French American Indian (44.1%, a difference of 0.080%), Immigrants from Kenya (44.1%, a difference of 0.090%), Yup'ik (44.1%, a difference of 0.14%), and Central American (43.9%, a difference of 0.19%).
| Demographics | Rating | Rank | Married-couple Households |
| Immigrants | Armenia | 0.7 /100 | #244 | Tragic 44.3% |
| Immigrants | El Salvador | 0.7 /100 | #245 | Tragic 44.3% |
| Immigrants | Cuba | 0.6 /100 | #246 | Tragic 44.2% |
| Immigrants | Morocco | 0.6 /100 | #247 | Tragic 44.2% |
| Yup'ik | 0.4 /100 | #248 | Tragic 44.1% |
| Immigrants | Kenya | 0.4 /100 | #249 | Tragic 44.1% |
| French American Indians | 0.4 /100 | #250 | Tragic 44.1% |
| German Russians | 0.4 /100 | #251 | Tragic 44.0% |
| Seminole | 0.4 /100 | #252 | Tragic 44.0% |
| Central Americans | 0.3 /100 | #253 | Tragic 43.9% |
| Apache | 0.3 /100 | #254 | Tragic 43.9% |
| Shoshone | 0.3 /100 | #255 | Tragic 43.9% |
| Ugandans | 0.3 /100 | #256 | Tragic 43.8% |
| Blackfeet | 0.2 /100 | #257 | Tragic 43.8% |
| Central American Indians | 0.2 /100 | #258 | Tragic 43.8% |
Demographics Similar to Immigrants from Chile by Married-couple Households
In terms of married-couple households, the demographic groups most similar to Immigrants from Chile are Immigrants from Australia (46.5%, a difference of 0.040%), South American (46.6%, a difference of 0.090%), Spanish American Indian (46.6%, a difference of 0.14%), Immigrants from Norway (46.5%, a difference of 0.14%), and Immigrants from Mexico (46.4%, a difference of 0.22%).
| Demographics | Rating | Rank | Married-couple Households |
| Immigrants | Kazakhstan | 70.0 /100 | #164 | Good 46.8% |
| Immigrants | Southern Europe | 69.9 /100 | #165 | Good 46.8% |
| Cherokee | 65.7 /100 | #166 | Good 46.7% |
| Immigrants | Croatia | 64.2 /100 | #167 | Good 46.7% |
| Israelis | 62.3 /100 | #168 | Good 46.7% |
| Spanish American Indians | 59.4 /100 | #169 | Average 46.6% |
| South Americans | 58.0 /100 | #170 | Average 46.6% |
| Immigrants | Chile | 55.7 /100 | #171 | Average 46.5% |
| Immigrants | Australia | 54.6 /100 | #172 | Average 46.5% |
| Immigrants | Norway | 52.0 /100 | #173 | Average 46.5% |
| Immigrants | Mexico | 50.0 /100 | #174 | Average 46.4% |
| Immigrants | Colombia | 46.1 /100 | #175 | Average 46.4% |
| Cajuns | 45.2 /100 | #176 | Average 46.4% |
| Immigrants | Immigrants | 43.8 /100 | #177 | Average 46.3% |
| Immigrants | Costa Rica | 43.4 /100 | #178 | Average 46.3% |