French vs Black/African American Family Households with Children
COMPARE
French
Black/African American
Family Households with Children
Family Households with Children Comparison
French
Blacks/African Americans
26.7%
FAMILY HOUSEHOLDS WITH CHILDREN
0.7/ 100
METRIC RATING
271st/ 347
METRIC RANK
26.5%
FAMILY HOUSEHOLDS WITH CHILDREN
0.1/ 100
METRIC RATING
293rd/ 347
METRIC RANK
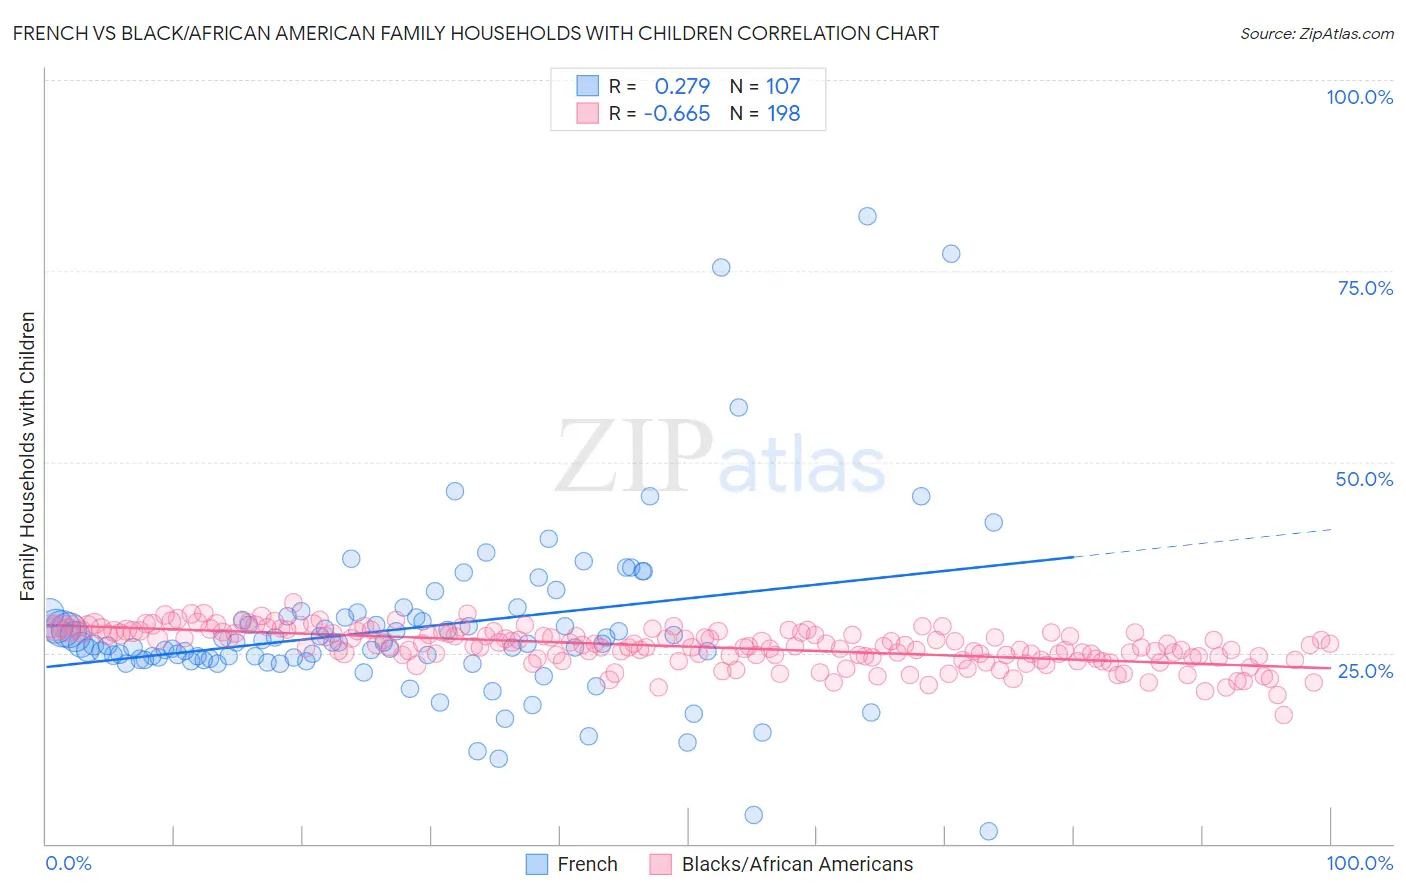
French vs Black/African American Family Households with Children Correlation Chart
The statistical analysis conducted on geographies consisting of 571,388,158 people shows a weak positive correlation between the proportion of French and percentage of family households with children in the United States with a correlation coefficient (R) of 0.279 and weighted average of 26.7%. Similarly, the statistical analysis conducted on geographies consisting of 564,937,994 people shows a significant negative correlation between the proportion of Blacks/African Americans and percentage of family households with children in the United States with a correlation coefficient (R) of -0.665 and weighted average of 26.5%, a difference of 0.92%.
Family Households with Children Correlation Summary
| Measurement | French | Black/African American |
| Minimum | 1.6% | 16.8% |
| Maximum | 82.1% | 31.5% |
| Range | 80.6% | 14.7% |
| Mean | 28.2% | 25.8% |
| Median | 26.1% | 26.0% |
| Interquartile 25% (IQ1) | 24.2% | 24.5% |
| Interquartile 75% (IQ3) | 29.6% | 27.7% |
| Interquartile Range (IQR) | 5.4% | 3.2% |
| Standard Deviation (Sample) | 11.5% | 2.5% |
| Standard Deviation (Population) | 11.5% | 2.4% |
Similar Demographics by Family Households with Children
Demographics Similar to French by Family Households with Children
In terms of family households with children, the demographic groups most similar to French are Immigrants from Zaire (26.7%, a difference of 0.010%), Somali (26.7%, a difference of 0.060%), Immigrants from Denmark (26.7%, a difference of 0.070%), Immigrants from Hungary (26.7%, a difference of 0.10%), and Eastern European (26.7%, a difference of 0.10%).
| Demographics | Rating | Rank | Family Households with Children |
| Taiwanese | 0.9 /100 | #264 | Tragic 26.7% |
| Chippewa | 0.9 /100 | #265 | Tragic 26.7% |
| Maltese | 0.9 /100 | #266 | Tragic 26.7% |
| Immigrants | Uzbekistan | 0.9 /100 | #267 | Tragic 26.7% |
| Immigrants | Belgium | 0.9 /100 | #268 | Tragic 26.7% |
| Immigrants | Denmark | 0.8 /100 | #269 | Tragic 26.7% |
| Immigrants | Zaire | 0.7 /100 | #270 | Tragic 26.7% |
| French | 0.7 /100 | #271 | Tragic 26.7% |
| Somalis | 0.7 /100 | #272 | Tragic 26.7% |
| Immigrants | Hungary | 0.6 /100 | #273 | Tragic 26.7% |
| Eastern Europeans | 0.6 /100 | #274 | Tragic 26.7% |
| Immigrants | Northern Europe | 0.5 /100 | #275 | Tragic 26.7% |
| Immigrants | Spain | 0.5 /100 | #276 | Tragic 26.6% |
| Celtics | 0.4 /100 | #277 | Tragic 26.6% |
| Immigrants | Europe | 0.4 /100 | #278 | Tragic 26.6% |
Demographics Similar to Blacks/African Americans by Family Households with Children
In terms of family households with children, the demographic groups most similar to Blacks/African Americans are Polish (26.5%, a difference of 0.050%), Albanian (26.5%, a difference of 0.060%), Bahamian (26.5%, a difference of 0.060%), Latvian (26.4%, a difference of 0.060%), and Macedonian (26.4%, a difference of 0.13%).
| Demographics | Rating | Rank | Family Households with Children |
| Immigrants | Senegal | 0.2 /100 | #286 | Tragic 26.5% |
| Shoshone | 0.2 /100 | #287 | Tragic 26.5% |
| Russians | 0.2 /100 | #288 | Tragic 26.5% |
| Immigrants | Sweden | 0.2 /100 | #289 | Tragic 26.5% |
| Albanians | 0.2 /100 | #290 | Tragic 26.5% |
| Bahamians | 0.2 /100 | #291 | Tragic 26.5% |
| Poles | 0.2 /100 | #292 | Tragic 26.5% |
| Blacks/African Americans | 0.1 /100 | #293 | Tragic 26.5% |
| Latvians | 0.1 /100 | #294 | Tragic 26.4% |
| Macedonians | 0.1 /100 | #295 | Tragic 26.4% |
| Croatians | 0.1 /100 | #296 | Tragic 26.4% |
| Armenians | 0.1 /100 | #297 | Tragic 26.4% |
| Immigrants | Western Europe | 0.1 /100 | #298 | Tragic 26.4% |
| Trinidadians and Tobagonians | 0.1 /100 | #299 | Tragic 26.4% |
| Paiute | 0.1 /100 | #300 | Tragic 26.4% |