French Canadian vs Nicaraguan Single Mother Households
COMPARE
French Canadian
Nicaraguan
Single Mother Households
Single Mother Households Comparison
French Canadians
Nicaraguans
6.0%
SINGLE MOTHER HOUSEHOLDS
82.6/ 100
METRIC RATING
146th/ 347
METRIC RANK
7.2%
SINGLE MOTHER HOUSEHOLDS
0.5/ 100
METRIC RATING
246th/ 347
METRIC RANK
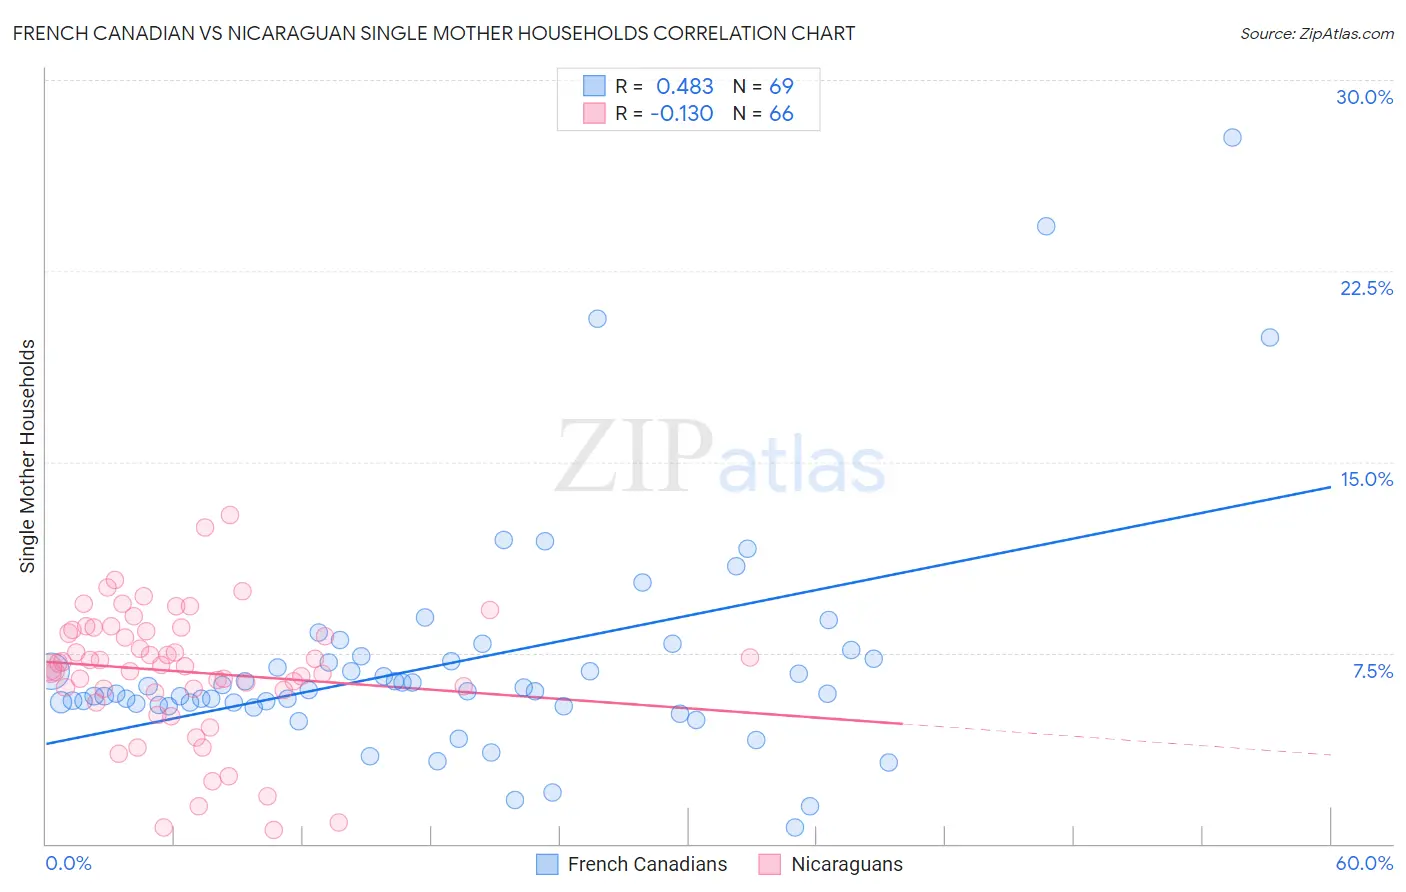
French Canadian vs Nicaraguan Single Mother Households Correlation Chart
The statistical analysis conducted on geographies consisting of 499,765,796 people shows a moderate positive correlation between the proportion of French Canadians and percentage of single mother households in the United States with a correlation coefficient (R) of 0.483 and weighted average of 6.0%. Similarly, the statistical analysis conducted on geographies consisting of 285,416,265 people shows a poor negative correlation between the proportion of Nicaraguans and percentage of single mother households in the United States with a correlation coefficient (R) of -0.130 and weighted average of 7.2%, a difference of 19.8%.
Single Mother Households Correlation Summary
| Measurement | French Canadian | Nicaraguan |
| Minimum | 0.62% | 0.56% |
| Maximum | 27.8% | 12.9% |
| Range | 27.1% | 12.4% |
| Mean | 7.1% | 6.8% |
| Median | 6.0% | 7.0% |
| Interquartile 25% (IQ1) | 5.5% | 6.0% |
| Interquartile 75% (IQ3) | 7.3% | 8.4% |
| Interquartile Range (IQR) | 1.8% | 2.3% |
| Standard Deviation (Sample) | 4.6% | 2.6% |
| Standard Deviation (Population) | 4.6% | 2.5% |
Similar Demographics by Single Mother Households
Demographics Similar to French Canadians by Single Mother Households
In terms of single mother households, the demographic groups most similar to French Canadians are Immigrants from Jordan (6.0%, a difference of 0.060%), Scotch-Irish (6.0%, a difference of 0.11%), Immigrants from Albania (6.1%, a difference of 0.21%), Arab (6.0%, a difference of 0.29%), and Zimbabwean (6.1%, a difference of 0.35%).
| Demographics | Rating | Rank | Single Mother Households |
| Syrians | 86.0 /100 | #139 | Excellent 6.0% |
| French | 85.7 /100 | #140 | Excellent 6.0% |
| Tsimshian | 85.2 /100 | #141 | Excellent 6.0% |
| Immigrants | Egypt | 85.0 /100 | #142 | Excellent 6.0% |
| Immigrants | Iraq | 84.8 /100 | #143 | Excellent 6.0% |
| Koreans | 84.4 /100 | #144 | Excellent 6.0% |
| Arabs | 84.0 /100 | #145 | Excellent 6.0% |
| French Canadians | 82.6 /100 | #146 | Excellent 6.0% |
| Immigrants | Jordan | 82.3 /100 | #147 | Excellent 6.0% |
| Scotch-Irish | 82.0 /100 | #148 | Excellent 6.0% |
| Immigrants | Albania | 81.5 /100 | #149 | Excellent 6.1% |
| Zimbabweans | 80.7 /100 | #150 | Excellent 6.1% |
| Immigrants | Southern Europe | 80.5 /100 | #151 | Excellent 6.1% |
| Pakistanis | 79.2 /100 | #152 | Good 6.1% |
| Immigrants | Brazil | 78.9 /100 | #153 | Good 6.1% |
Demographics Similar to Nicaraguans by Single Mother Households
In terms of single mother households, the demographic groups most similar to Nicaraguans are Immigrants from Cambodia (7.2%, a difference of 0.18%), Dutch West Indian (7.3%, a difference of 0.25%), Spanish American Indian (7.3%, a difference of 0.28%), Cuban (7.2%, a difference of 0.53%), and Bermudan (7.3%, a difference of 0.57%).
| Demographics | Rating | Rank | Single Mother Households |
| Kiowa | 0.8 /100 | #239 | Tragic 7.1% |
| Immigrants | Panama | 0.7 /100 | #240 | Tragic 7.2% |
| Immigrants | Portugal | 0.6 /100 | #241 | Tragic 7.2% |
| Fijians | 0.6 /100 | #242 | Tragic 7.2% |
| Ecuadorians | 0.6 /100 | #243 | Tragic 7.2% |
| Cubans | 0.6 /100 | #244 | Tragic 7.2% |
| Immigrants | Cambodia | 0.5 /100 | #245 | Tragic 7.2% |
| Nicaraguans | 0.5 /100 | #246 | Tragic 7.2% |
| Dutch West Indians | 0.4 /100 | #247 | Tragic 7.3% |
| Spanish American Indians | 0.4 /100 | #248 | Tragic 7.3% |
| Bermudans | 0.4 /100 | #249 | Tragic 7.3% |
| Immigrants | Africa | 0.4 /100 | #250 | Tragic 7.3% |
| Malaysians | 0.3 /100 | #251 | Tragic 7.3% |
| Alaskan Athabascans | 0.3 /100 | #252 | Tragic 7.3% |
| Cajuns | 0.3 /100 | #253 | Tragic 7.3% |