French American Indian vs Immigrants from Northern Europe Divorced or Separated
COMPARE
French American Indian
Immigrants from Northern Europe
Divorced or Separated
Divorced or Separated Comparison
French American Indians
Immigrants from Northern Europe
13.2%
DIVORCED OR SEPARATED
0.0/ 100
METRIC RATING
307th/ 347
METRIC RANK
11.6%
DIVORCED OR SEPARATED
98.6/ 100
METRIC RATING
100th/ 347
METRIC RANK
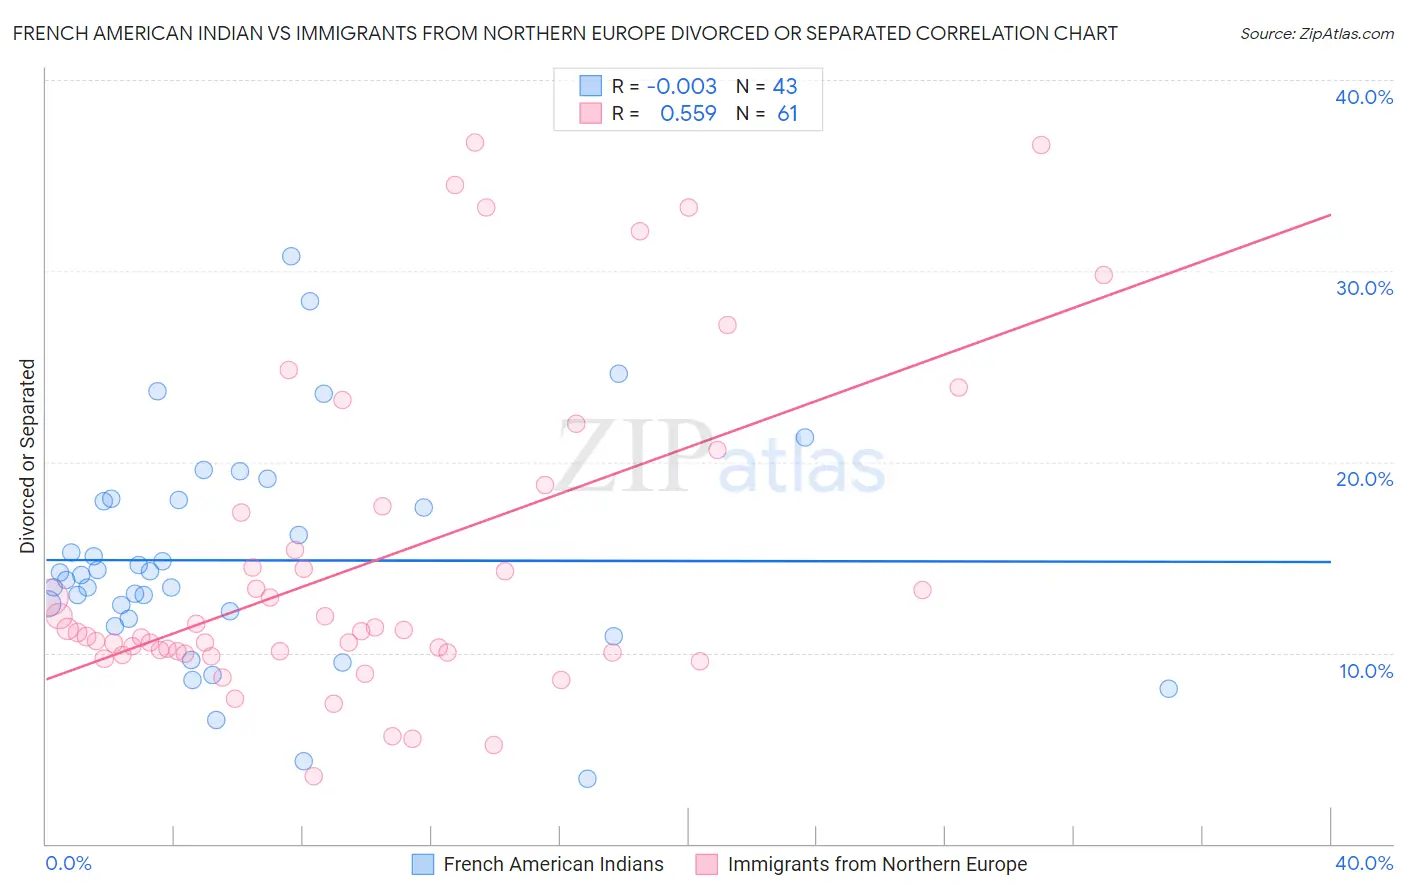
French American Indian vs Immigrants from Northern Europe Divorced or Separated Correlation Chart
The statistical analysis conducted on geographies consisting of 131,970,450 people shows no correlation between the proportion of French American Indians and percentage of population currently divorced or separated in the United States with a correlation coefficient (R) of -0.003 and weighted average of 13.2%. Similarly, the statistical analysis conducted on geographies consisting of 477,042,338 people shows a substantial positive correlation between the proportion of Immigrants from Northern Europe and percentage of population currently divorced or separated in the United States with a correlation coefficient (R) of 0.559 and weighted average of 11.6%, a difference of 13.8%.
Divorced or Separated Correlation Summary
| Measurement | French American Indian | Immigrants from Northern Europe |
| Minimum | 3.4% | 3.5% |
| Maximum | 30.8% | 36.7% |
| Range | 27.4% | 33.2% |
| Mean | 14.8% | 14.7% |
| Median | 14.1% | 11.1% |
| Interquartile 25% (IQ1) | 11.8% | 10.0% |
| Interquartile 75% (IQ3) | 18.0% | 17.5% |
| Interquartile Range (IQR) | 6.2% | 7.5% |
| Standard Deviation (Sample) | 5.8% | 8.4% |
| Standard Deviation (Population) | 5.7% | 8.3% |
Similar Demographics by Divorced or Separated
Demographics Similar to French American Indians by Divorced or Separated
In terms of divorced or separated, the demographic groups most similar to French American Indians are Ottawa (13.2%, a difference of 0.090%), American (13.2%, a difference of 0.10%), African (13.2%, a difference of 0.12%), Sioux (13.2%, a difference of 0.14%), and Tlingit-Haida (13.2%, a difference of 0.25%).
| Demographics | Rating | Rank | Divorced or Separated |
| Immigrants | Cabo Verde | 0.0 /100 | #300 | Tragic 13.1% |
| Alaskan Athabascans | 0.0 /100 | #301 | Tragic 13.1% |
| Immigrants | Venezuela | 0.0 /100 | #302 | Tragic 13.1% |
| Cape Verdeans | 0.0 /100 | #303 | Tragic 13.1% |
| Hopi | 0.0 /100 | #304 | Tragic 13.2% |
| Chippewa | 0.0 /100 | #305 | Tragic 13.2% |
| Tlingit-Haida | 0.0 /100 | #306 | Tragic 13.2% |
| French American Indians | 0.0 /100 | #307 | Tragic 13.2% |
| Ottawa | 0.0 /100 | #308 | Tragic 13.2% |
| Americans | 0.0 /100 | #309 | Tragic 13.2% |
| Africans | 0.0 /100 | #310 | Tragic 13.2% |
| Sioux | 0.0 /100 | #311 | Tragic 13.2% |
| Blackfeet | 0.0 /100 | #312 | Tragic 13.3% |
| Immigrants | Nicaragua | 0.0 /100 | #313 | Tragic 13.3% |
| Yaqui | 0.0 /100 | #314 | Tragic 13.3% |
Demographics Similar to Immigrants from Northern Europe by Divorced or Separated
In terms of divorced or separated, the demographic groups most similar to Immigrants from Northern Europe are Immigrants from Sweden (11.6%, a difference of 0.030%), Immigrants from Guyana (11.6%, a difference of 0.030%), Immigrants from Jordan (11.6%, a difference of 0.050%), Latvian (11.6%, a difference of 0.090%), and Immigrants from Ukraine (11.6%, a difference of 0.11%).
| Demographics | Rating | Rank | Divorced or Separated |
| Arabs | 98.9 /100 | #93 | Exceptional 11.6% |
| Immigrants | Fiji | 98.9 /100 | #94 | Exceptional 11.6% |
| Immigrants | Serbia | 98.8 /100 | #95 | Exceptional 11.6% |
| Immigrants | Ukraine | 98.7 /100 | #96 | Exceptional 11.6% |
| Latvians | 98.7 /100 | #97 | Exceptional 11.6% |
| Immigrants | Jordan | 98.6 /100 | #98 | Exceptional 11.6% |
| Immigrants | Sweden | 98.6 /100 | #99 | Exceptional 11.6% |
| Immigrants | Northern Europe | 98.6 /100 | #100 | Exceptional 11.6% |
| Immigrants | Guyana | 98.5 /100 | #101 | Exceptional 11.6% |
| Immigrants | Croatia | 98.3 /100 | #102 | Exceptional 11.6% |
| Maltese | 98.2 /100 | #103 | Exceptional 11.6% |
| Salvadorans | 98.2 /100 | #104 | Exceptional 11.6% |
| Immigrants | El Salvador | 97.9 /100 | #105 | Exceptional 11.7% |
| Immigrants | Kazakhstan | 97.8 /100 | #106 | Exceptional 11.7% |
| Native Hawaiians | 97.2 /100 | #107 | Exceptional 11.7% |