European vs Vietnamese Currently Married
COMPARE
European
Vietnamese
Currently Married
Currently Married Comparison
Europeans
Vietnamese
49.3%
CURRENTLY MARRIED
99.8/ 100
METRIC RATING
19th/ 347
METRIC RANK
44.0%
CURRENTLY MARRIED
0.2/ 100
METRIC RATING
254th/ 347
METRIC RANK
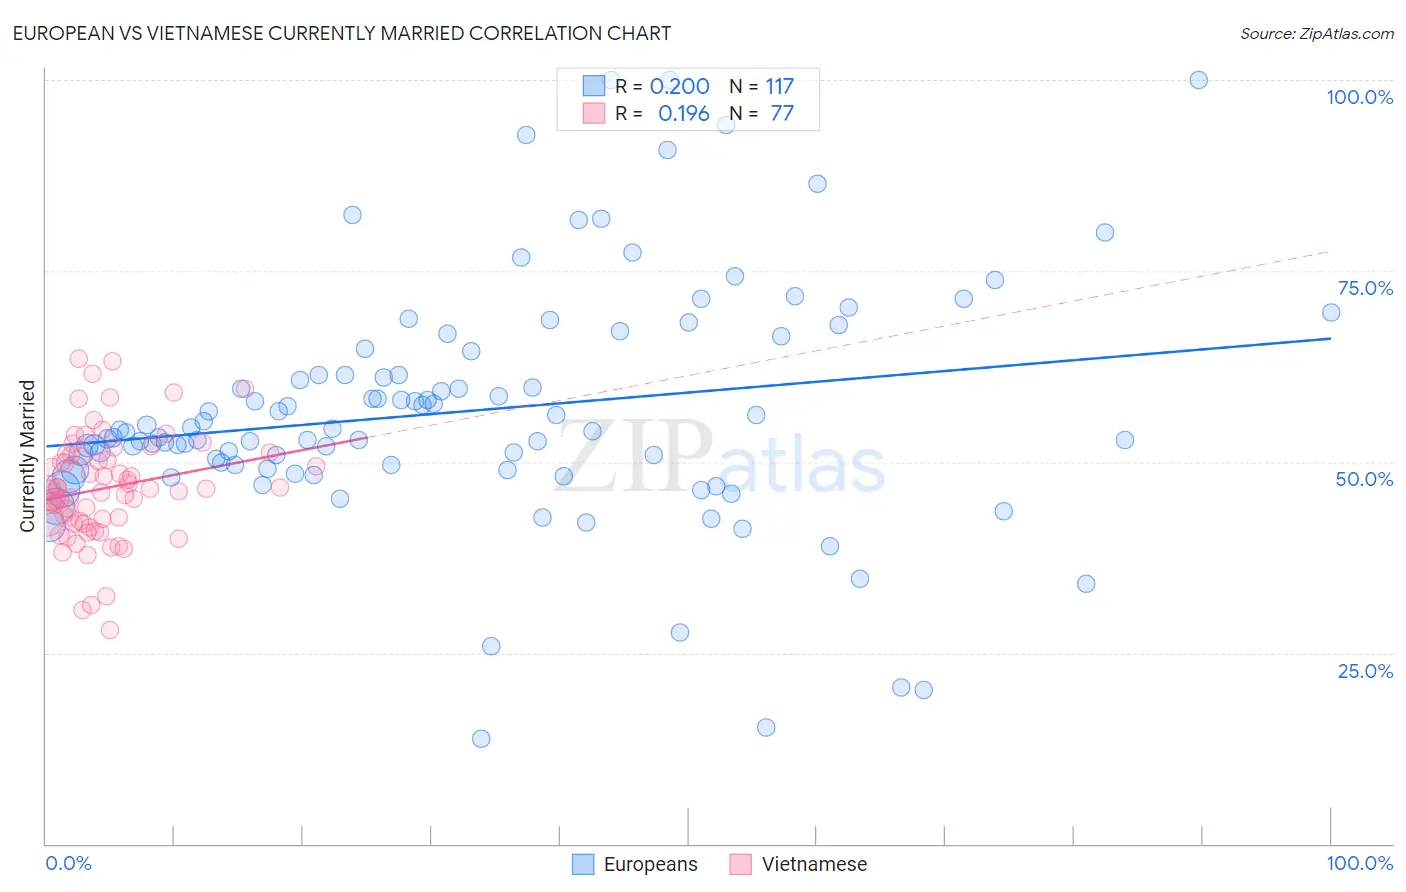
European vs Vietnamese Currently Married Correlation Chart
The statistical analysis conducted on geographies consisting of 561,708,680 people shows a poor positive correlation between the proportion of Europeans and percentage of population currently married in the United States with a correlation coefficient (R) of 0.200 and weighted average of 49.3%. Similarly, the statistical analysis conducted on geographies consisting of 170,739,773 people shows a poor positive correlation between the proportion of Vietnamese and percentage of population currently married in the United States with a correlation coefficient (R) of 0.196 and weighted average of 44.0%, a difference of 12.1%.
Currently Married Correlation Summary
| Measurement | European | Vietnamese |
| Minimum | 13.8% | 27.9% |
| Maximum | 100.0% | 63.6% |
| Range | 86.2% | 35.7% |
| Mean | 56.7% | 46.5% |
| Median | 53.8% | 46.3% |
| Interquartile 25% (IQ1) | 49.0% | 42.1% |
| Interquartile 75% (IQ3) | 62.9% | 50.8% |
| Interquartile Range (IQR) | 13.9% | 8.7% |
| Standard Deviation (Sample) | 15.8% | 7.1% |
| Standard Deviation (Population) | 15.7% | 7.0% |
Similar Demographics by Currently Married
Demographics Similar to Europeans by Currently Married
In terms of currently married, the demographic groups most similar to Europeans are Immigrants from Scotland (49.3%, a difference of 0.020%), Luxembourger (49.3%, a difference of 0.14%), Scottish (49.2%, a difference of 0.24%), Scandinavian (49.5%, a difference of 0.31%), and Chinese (49.5%, a difference of 0.33%).
| Demographics | Rating | Rank | Currently Married |
| Swiss | 99.9 /100 | #12 | Exceptional 49.7% |
| Dutch | 99.9 /100 | #13 | Exceptional 49.6% |
| Germans | 99.9 /100 | #14 | Exceptional 49.6% |
| Pennsylvania Germans | 99.9 /100 | #15 | Exceptional 49.6% |
| Chinese | 99.9 /100 | #16 | Exceptional 49.5% |
| Scandinavians | 99.9 /100 | #17 | Exceptional 49.5% |
| Immigrants | Scotland | 99.8 /100 | #18 | Exceptional 49.3% |
| Europeans | 99.8 /100 | #19 | Exceptional 49.3% |
| Luxembourgers | 99.8 /100 | #20 | Exceptional 49.3% |
| Scottish | 99.8 /100 | #21 | Exceptional 49.2% |
| Bulgarians | 99.7 /100 | #22 | Exceptional 49.1% |
| Immigrants | Pakistan | 99.7 /100 | #23 | Exceptional 49.1% |
| Lithuanians | 99.6 /100 | #24 | Exceptional 49.0% |
| Maltese | 99.6 /100 | #25 | Exceptional 49.0% |
| Immigrants | Korea | 99.6 /100 | #26 | Exceptional 49.0% |
Demographics Similar to Vietnamese by Currently Married
In terms of currently married, the demographic groups most similar to Vietnamese are Yakama (44.0%, a difference of 0.070%), Shoshone (44.0%, a difference of 0.12%), Immigrants from Central America (44.1%, a difference of 0.24%), Hispanic or Latino (44.1%, a difference of 0.28%), and Blackfeet (44.2%, a difference of 0.30%).
| Demographics | Rating | Rank | Currently Married |
| Ugandans | 0.4 /100 | #247 | Tragic 44.2% |
| Nicaraguans | 0.3 /100 | #248 | Tragic 44.2% |
| Immigrants | Cameroon | 0.3 /100 | #249 | Tragic 44.2% |
| Immigrants | Eastern Africa | 0.3 /100 | #250 | Tragic 44.2% |
| Blackfeet | 0.3 /100 | #251 | Tragic 44.2% |
| Hispanics or Latinos | 0.3 /100 | #252 | Tragic 44.1% |
| Immigrants | Central America | 0.3 /100 | #253 | Tragic 44.1% |
| Vietnamese | 0.2 /100 | #254 | Tragic 44.0% |
| Yakama | 0.2 /100 | #255 | Tragic 44.0% |
| Shoshone | 0.2 /100 | #256 | Tragic 44.0% |
| Immigrants | Africa | 0.2 /100 | #257 | Tragic 43.9% |
| Ute | 0.2 /100 | #258 | Tragic 43.9% |
| Immigrants | Sierra Leone | 0.1 /100 | #259 | Tragic 43.8% |
| Immigrants | Latin America | 0.1 /100 | #260 | Tragic 43.8% |
| Immigrants | Nicaragua | 0.1 /100 | #261 | Tragic 43.7% |