Estonian vs Arapaho Births to Unmarried Women
COMPARE
Estonian
Arapaho
Births to Unmarried Women
Births to Unmarried Women Comparison
Estonians
Arapaho
29.2%
BIRTHS TO UNMARRIED WOMEN
96.5/ 100
METRIC RATING
93rd/ 347
METRIC RANK
47.1%
BIRTHS TO UNMARRIED WOMEN
0.0/ 100
METRIC RATING
338th/ 347
METRIC RANK
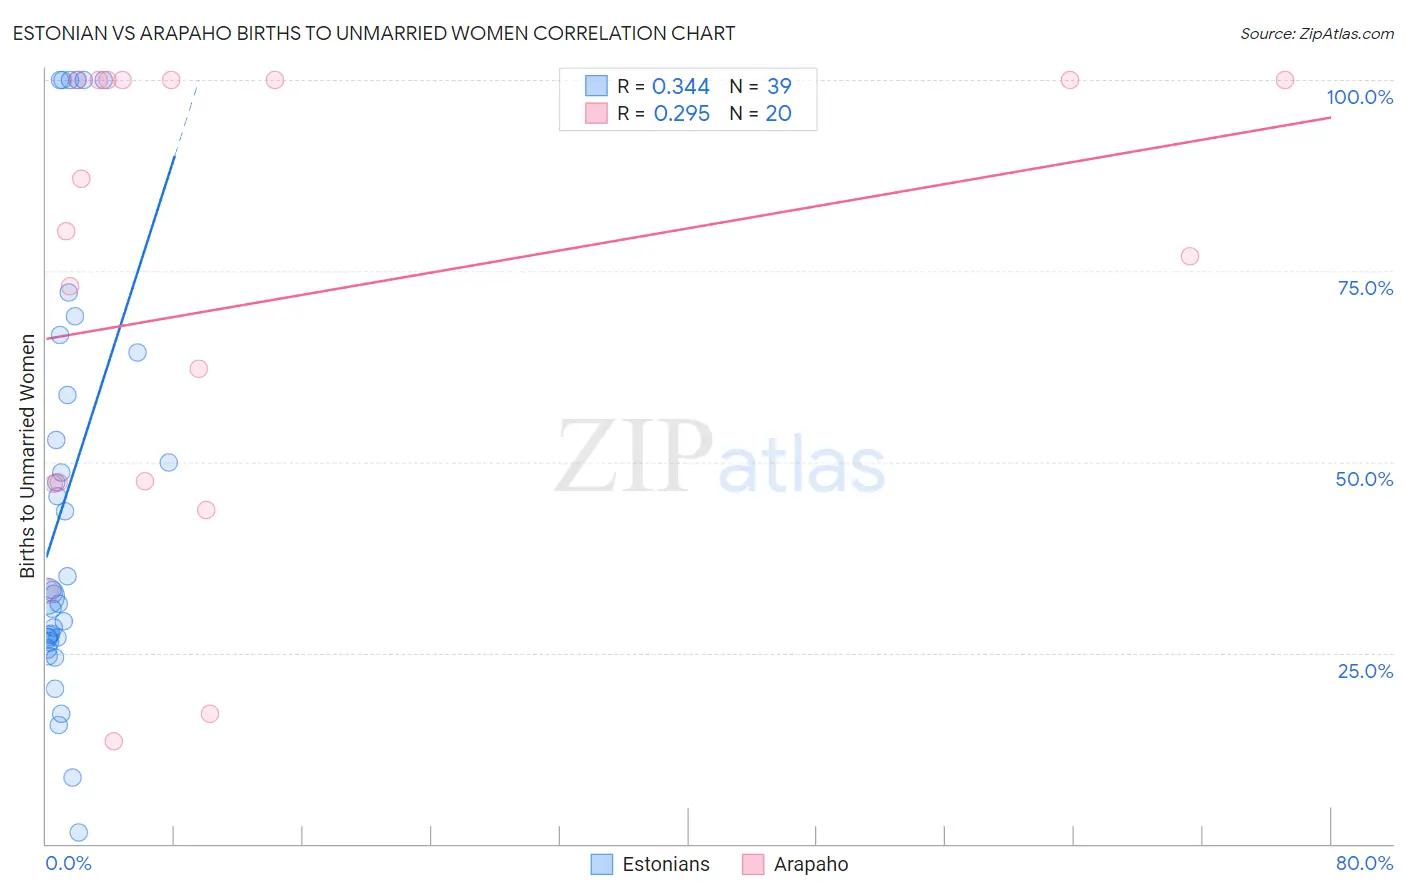
Estonian vs Arapaho Births to Unmarried Women Correlation Chart
The statistical analysis conducted on geographies consisting of 118,165,296 people shows a mild positive correlation between the proportion of Estonians and percentage of births to unmarried women in the United States with a correlation coefficient (R) of 0.344 and weighted average of 29.2%. Similarly, the statistical analysis conducted on geographies consisting of 29,148,677 people shows a weak positive correlation between the proportion of Arapaho and percentage of births to unmarried women in the United States with a correlation coefficient (R) of 0.295 and weighted average of 47.1%, a difference of 61.4%.
Births to Unmarried Women Correlation Summary
| Measurement | Estonian | Arapaho |
| Minimum | 1.4% | 13.4% |
| Maximum | 100.0% | 100.0% |
| Range | 98.6% | 86.6% |
| Mean | 45.4% | 71.4% |
| Median | 32.7% | 78.6% |
| Interquartile 25% (IQ1) | 26.9% | 47.2% |
| Interquartile 75% (IQ3) | 64.3% | 100.0% |
| Interquartile Range (IQR) | 37.4% | 52.8% |
| Standard Deviation (Sample) | 28.4% | 30.2% |
| Standard Deviation (Population) | 28.1% | 29.4% |
Similar Demographics by Births to Unmarried Women
Demographics Similar to Estonians by Births to Unmarried Women
In terms of births to unmarried women, the demographic groups most similar to Estonians are Arab (29.2%, a difference of 0.040%), Immigrants from Fiji (29.2%, a difference of 0.080%), Ukrainian (29.2%, a difference of 0.12%), Immigrants from Vietnam (29.3%, a difference of 0.26%), and Immigrants from Latvia (29.1%, a difference of 0.29%).
| Demographics | Rating | Rank | Births to Unmarried Women |
| Immigrants | Jordan | 97.4 /100 | #86 | Exceptional 29.0% |
| Taiwanese | 97.3 /100 | #87 | Exceptional 29.0% |
| Immigrants | France | 97.3 /100 | #88 | Exceptional 29.0% |
| Immigrants | Saudi Arabia | 97.0 /100 | #89 | Exceptional 29.1% |
| Immigrants | Latvia | 96.8 /100 | #90 | Exceptional 29.1% |
| Immigrants | Fiji | 96.6 /100 | #91 | Exceptional 29.2% |
| Arabs | 96.5 /100 | #92 | Exceptional 29.2% |
| Estonians | 96.5 /100 | #93 | Exceptional 29.2% |
| Ukrainians | 96.3 /100 | #94 | Exceptional 29.2% |
| Immigrants | Vietnam | 96.1 /100 | #95 | Exceptional 29.3% |
| Norwegians | 95.8 /100 | #96 | Exceptional 29.3% |
| Immigrants | South Africa | 95.7 /100 | #97 | Exceptional 29.3% |
| Immigrants | Syria | 95.7 /100 | #98 | Exceptional 29.4% |
| Immigrants | Denmark | 95.3 /100 | #99 | Exceptional 29.4% |
| Luxembourgers | 95.2 /100 | #100 | Exceptional 29.4% |
Demographics Similar to Arapaho by Births to Unmarried Women
In terms of births to unmarried women, the demographic groups most similar to Arapaho are Houma (46.6%, a difference of 1.2%), Lumbee (48.2%, a difference of 2.3%), Puerto Rican (45.7%, a difference of 3.2%), Colville (45.3%, a difference of 4.0%), and Tohono O'odham (49.8%, a difference of 5.8%).
| Demographics | Rating | Rank | Births to Unmarried Women |
| Natives/Alaskans | 0.0 /100 | #331 | Tragic 43.0% |
| Kiowa | 0.0 /100 | #332 | Tragic 43.1% |
| Blacks/African Americans | 0.0 /100 | #333 | Tragic 44.3% |
| Yuman | 0.0 /100 | #334 | Tragic 44.4% |
| Colville | 0.0 /100 | #335 | Tragic 45.3% |
| Puerto Ricans | 0.0 /100 | #336 | Tragic 45.7% |
| Houma | 0.0 /100 | #337 | Tragic 46.6% |
| Arapaho | 0.0 /100 | #338 | Tragic 47.1% |
| Lumbee | 0.0 /100 | #339 | Tragic 48.2% |
| Tohono O'odham | 0.0 /100 | #340 | Tragic 49.8% |
| Hopi | 0.0 /100 | #341 | Tragic 50.8% |
| Menominee | 0.0 /100 | #342 | Tragic 51.1% |
| Pima | 0.0 /100 | #343 | Tragic 51.5% |
| Navajo | 0.0 /100 | #344 | Tragic 51.5% |
| Inupiat | 0.0 /100 | #345 | Tragic 52.1% |