Eastern European vs Cypriot Currently Married
COMPARE
Eastern European
Cypriot
Currently Married
Currently Married Comparison
Eastern Europeans
Cypriots
48.9%
CURRENTLY MARRIED
99.5/ 100
METRIC RATING
30th/ 347
METRIC RANK
47.8%
CURRENTLY MARRIED
93.7/ 100
METRIC RATING
103rd/ 347
METRIC RANK
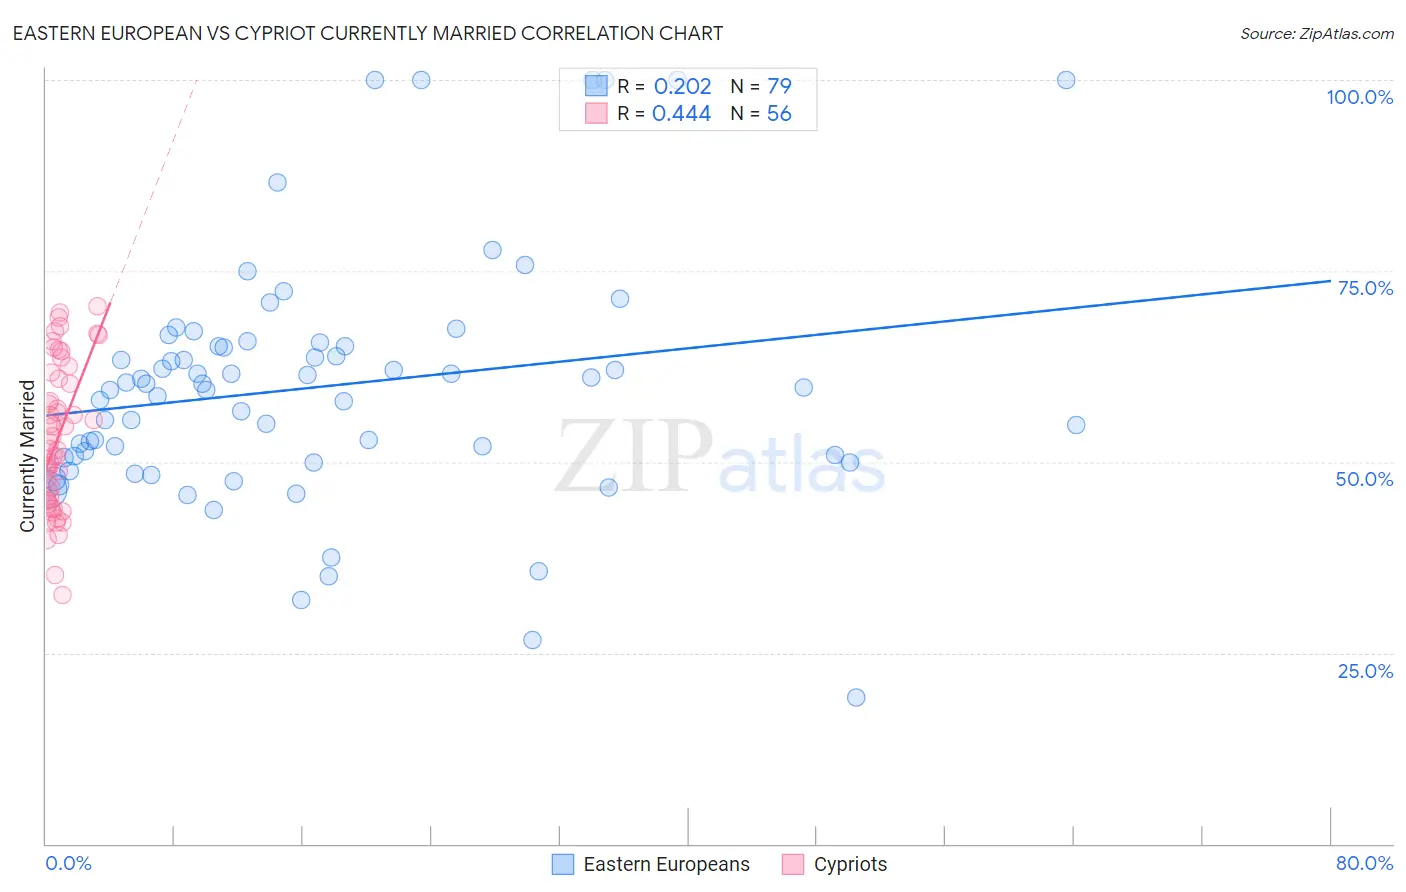
Eastern European vs Cypriot Currently Married Correlation Chart
The statistical analysis conducted on geographies consisting of 461,211,014 people shows a weak positive correlation between the proportion of Eastern Europeans and percentage of population currently married in the United States with a correlation coefficient (R) of 0.202 and weighted average of 48.9%. Similarly, the statistical analysis conducted on geographies consisting of 61,862,826 people shows a moderate positive correlation between the proportion of Cypriots and percentage of population currently married in the United States with a correlation coefficient (R) of 0.444 and weighted average of 47.8%, a difference of 2.3%.
Currently Married Correlation Summary
| Measurement | Eastern European | Cypriot |
| Minimum | 19.2% | 32.6% |
| Maximum | 100.0% | 70.4% |
| Range | 80.8% | 37.8% |
| Mean | 59.9% | 53.2% |
| Median | 59.8% | 52.1% |
| Interquartile 25% (IQ1) | 50.5% | 44.9% |
| Interquartile 75% (IQ3) | 65.2% | 61.3% |
| Interquartile Range (IQR) | 14.7% | 16.4% |
| Standard Deviation (Sample) | 16.1% | 9.6% |
| Standard Deviation (Population) | 16.0% | 9.5% |
Similar Demographics by Currently Married
Demographics Similar to Eastern Europeans by Currently Married
In terms of currently married, the demographic groups most similar to Eastern Europeans are Polish (48.9%, a difference of 0.0%), Croatian (48.9%, a difference of 0.010%), Immigrants from Hong Kong (48.9%, a difference of 0.010%), Irish (48.9%, a difference of 0.050%), and Welsh (48.9%, a difference of 0.060%).
| Demographics | Rating | Rank | Currently Married |
| Immigrants | Pakistan | 99.7 /100 | #23 | Exceptional 49.1% |
| Lithuanians | 99.6 /100 | #24 | Exceptional 49.0% |
| Maltese | 99.6 /100 | #25 | Exceptional 49.0% |
| Immigrants | Korea | 99.6 /100 | #26 | Exceptional 49.0% |
| Burmese | 99.6 /100 | #27 | Exceptional 48.9% |
| Welsh | 99.5 /100 | #28 | Exceptional 48.9% |
| Croatians | 99.5 /100 | #29 | Exceptional 48.9% |
| Eastern Europeans | 99.5 /100 | #30 | Exceptional 48.9% |
| Poles | 99.5 /100 | #31 | Exceptional 48.9% |
| Immigrants | Hong Kong | 99.5 /100 | #32 | Exceptional 48.9% |
| Irish | 99.5 /100 | #33 | Exceptional 48.9% |
| Immigrants | Lithuania | 99.4 /100 | #34 | Exceptional 48.8% |
| Immigrants | Northern Europe | 99.4 /100 | #35 | Exceptional 48.8% |
| Italians | 99.4 /100 | #36 | Exceptional 48.8% |
| Hungarians | 99.4 /100 | #37 | Exceptional 48.8% |
Demographics Similar to Cypriots by Currently Married
In terms of currently married, the demographic groups most similar to Cypriots are Serbian (47.8%, a difference of 0.020%), Turkish (47.8%, a difference of 0.030%), Immigrants from Germany (47.8%, a difference of 0.050%), Celtic (47.8%, a difference of 0.070%), and Immigrants from Singapore (47.8%, a difference of 0.070%).
| Demographics | Rating | Rank | Currently Married |
| Egyptians | 94.8 /100 | #96 | Exceptional 47.9% |
| Immigrants | Ukraine | 94.8 /100 | #97 | Exceptional 47.9% |
| Immigrants | China | 94.7 /100 | #98 | Exceptional 47.9% |
| Immigrants | Sweden | 94.3 /100 | #99 | Exceptional 47.8% |
| Celtics | 94.2 /100 | #100 | Exceptional 47.8% |
| Immigrants | Germany | 94.1 /100 | #101 | Exceptional 47.8% |
| Turks | 93.9 /100 | #102 | Exceptional 47.8% |
| Cypriots | 93.7 /100 | #103 | Exceptional 47.8% |
| Serbians | 93.6 /100 | #104 | Exceptional 47.8% |
| Immigrants | Singapore | 93.3 /100 | #105 | Exceptional 47.8% |
| Immigrants | Greece | 93.1 /100 | #106 | Exceptional 47.7% |
| Immigrants | Italy | 92.9 /100 | #107 | Exceptional 47.7% |
| Tsimshian | 92.4 /100 | #108 | Exceptional 47.7% |
| Immigrants | Egypt | 92.3 /100 | #109 | Exceptional 47.7% |
| Immigrants | Russia | 92.0 /100 | #110 | Exceptional 47.7% |