Dutch West Indian vs Samoan Married-couple Households
COMPARE
Dutch West Indian
Samoan
Married-couple Households
Married-couple Households Comparison
Dutch West Indians
Samoans
44.9%
MARRIED-COUPLE HOUSEHOLDS
2.6/ 100
METRIC RATING
225th/ 347
METRIC RANK
48.7%
MARRIED-COUPLE HOUSEHOLDS
99.4/ 100
METRIC RATING
50th/ 347
METRIC RANK
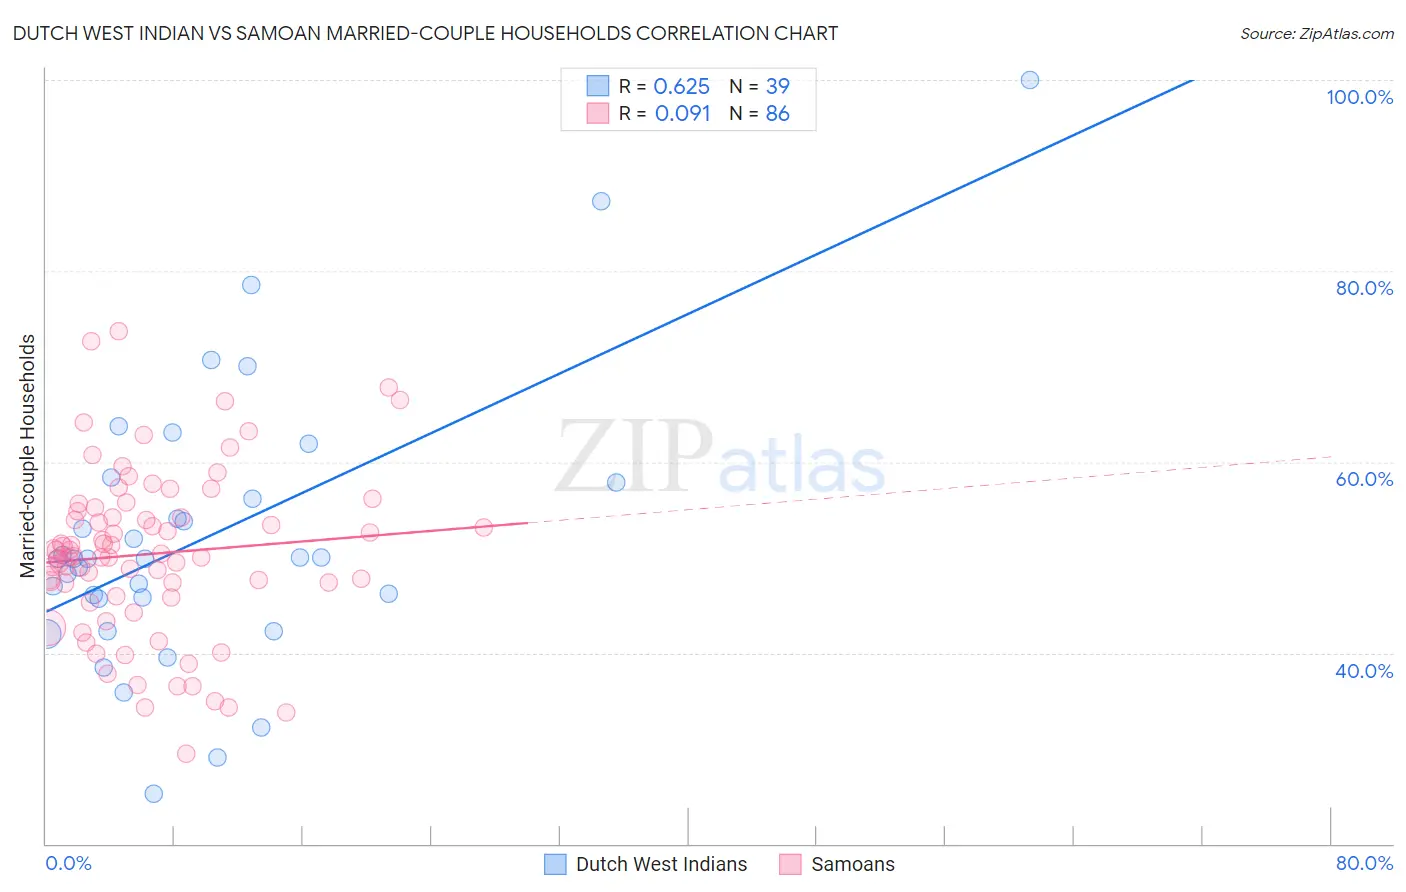
Dutch West Indian vs Samoan Married-couple Households Correlation Chart
The statistical analysis conducted on geographies consisting of 85,766,560 people shows a significant positive correlation between the proportion of Dutch West Indians and percentage of married-couple family households in the United States with a correlation coefficient (R) of 0.625 and weighted average of 44.9%. Similarly, the statistical analysis conducted on geographies consisting of 225,069,551 people shows a slight positive correlation between the proportion of Samoans and percentage of married-couple family households in the United States with a correlation coefficient (R) of 0.091 and weighted average of 48.7%, a difference of 8.5%.
Married-couple Households Correlation Summary
| Measurement | Dutch West Indian | Samoan |
| Minimum | 25.3% | 29.5% |
| Maximum | 100.0% | 73.6% |
| Range | 74.7% | 44.2% |
| Mean | 52.1% | 50.4% |
| Median | 49.8% | 50.2% |
| Interquartile 25% (IQ1) | 45.7% | 45.9% |
| Interquartile 75% (IQ3) | 57.9% | 54.9% |
| Interquartile Range (IQR) | 12.2% | 9.0% |
| Standard Deviation (Sample) | 14.6% | 8.7% |
| Standard Deviation (Population) | 14.5% | 8.7% |
Similar Demographics by Married-couple Households
Demographics Similar to Dutch West Indians by Married-couple Households
In terms of married-couple households, the demographic groups most similar to Dutch West Indians are Immigrants from Micronesia (44.9%, a difference of 0.020%), Immigrants from Cambodia (44.9%, a difference of 0.040%), Alsatian (44.8%, a difference of 0.10%), Salvadoran (44.7%, a difference of 0.29%), and Kenyan (44.7%, a difference of 0.42%).
| Demographics | Rating | Rank | Married-couple Households |
| Immigrants | Azores | 5.3 /100 | #218 | Tragic 45.2% |
| Nicaraguans | 5.3 /100 | #219 | Tragic 45.2% |
| Immigrants | Thailand | 5.1 /100 | #220 | Tragic 45.2% |
| Tlingit-Haida | 4.9 /100 | #221 | Tragic 45.1% |
| Immigrants | Laos | 4.6 /100 | #222 | Tragic 45.1% |
| Immigrants | Cambodia | 2.7 /100 | #223 | Tragic 44.9% |
| Immigrants | Micronesia | 2.6 /100 | #224 | Tragic 44.9% |
| Dutch West Indians | 2.6 /100 | #225 | Tragic 44.9% |
| Alsatians | 2.3 /100 | #226 | Tragic 44.8% |
| Salvadorans | 1.9 /100 | #227 | Tragic 44.7% |
| Kenyans | 1.7 /100 | #228 | Tragic 44.7% |
| Immigrants | Latin America | 1.6 /100 | #229 | Tragic 44.7% |
| Soviet Union | 1.6 /100 | #230 | Tragic 44.6% |
| Houma | 1.5 /100 | #231 | Tragic 44.6% |
| Marshallese | 1.5 /100 | #232 | Tragic 44.6% |
Demographics Similar to Samoans by Married-couple Households
In terms of married-couple households, the demographic groups most similar to Samoans are Immigrants from Sri Lanka (48.7%, a difference of 0.040%), Eastern European (48.6%, a difference of 0.040%), Irish (48.6%, a difference of 0.080%), Indian (Asian) (48.7%, a difference of 0.10%), and White/Caucasian (48.6%, a difference of 0.13%).
| Demographics | Rating | Rank | Married-couple Households |
| Immigrants | Iran | 99.6 /100 | #43 | Exceptional 48.8% |
| Welsh | 99.5 /100 | #44 | Exceptional 48.8% |
| Immigrants | Eastern Asia | 99.5 /100 | #45 | Exceptional 48.8% |
| Tsimshian | 99.5 /100 | #46 | Exceptional 48.7% |
| British | 99.5 /100 | #47 | Exceptional 48.7% |
| Indians (Asian) | 99.4 /100 | #48 | Exceptional 48.7% |
| Immigrants | Sri Lanka | 99.4 /100 | #49 | Exceptional 48.7% |
| Samoans | 99.4 /100 | #50 | Exceptional 48.7% |
| Eastern Europeans | 99.3 /100 | #51 | Exceptional 48.6% |
| Irish | 99.3 /100 | #52 | Exceptional 48.6% |
| Whites/Caucasians | 99.3 /100 | #53 | Exceptional 48.6% |
| Immigrants | Lithuania | 99.3 /100 | #54 | Exceptional 48.6% |
| Austrians | 99.3 /100 | #55 | Exceptional 48.6% |
| Immigrants | Northern Europe | 99.3 /100 | #56 | Exceptional 48.6% |
| Poles | 99.2 /100 | #57 | Exceptional 48.5% |