Immigrants from Micronesia vs Cree Single Mother Households
COMPARE
Immigrants from Micronesia
Cree
Single Mother Households
Single Mother Households Comparison
Immigrants from Micronesia
Cree
6.9%
SINGLE MOTHER HOUSEHOLDS
3.6/ 100
METRIC RATING
223rd/ 347
METRIC RANK
6.7%
SINGLE MOTHER HOUSEHOLDS
11.9/ 100
METRIC RATING
205th/ 347
METRIC RANK
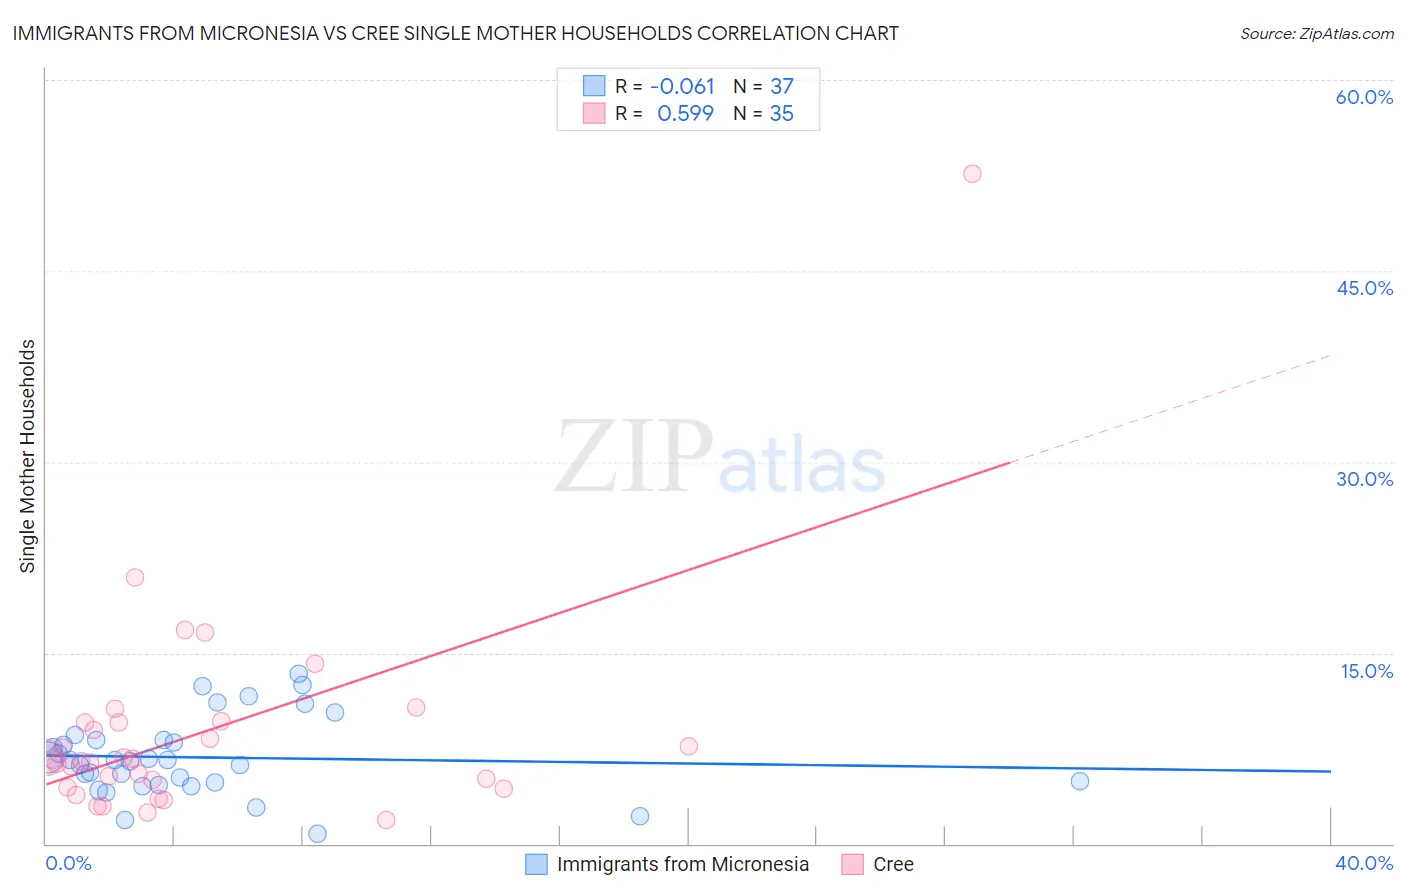
Immigrants from Micronesia vs Cree Single Mother Households Correlation Chart
The statistical analysis conducted on geographies consisting of 61,584,620 people shows a slight negative correlation between the proportion of Immigrants from Micronesia and percentage of single mother households in the United States with a correlation coefficient (R) of -0.061 and weighted average of 6.9%. Similarly, the statistical analysis conducted on geographies consisting of 76,173,088 people shows a substantial positive correlation between the proportion of Cree and percentage of single mother households in the United States with a correlation coefficient (R) of 0.599 and weighted average of 6.7%, a difference of 3.3%.
Single Mother Households Correlation Summary
| Measurement | Immigrants from Micronesia | Cree |
| Minimum | 0.77% | 1.9% |
| Maximum | 13.3% | 52.6% |
| Range | 12.5% | 50.8% |
| Mean | 6.8% | 8.7% |
| Median | 6.5% | 6.6% |
| Interquartile 25% (IQ1) | 4.7% | 4.4% |
| Interquartile 75% (IQ3) | 8.1% | 9.5% |
| Interquartile Range (IQR) | 3.4% | 5.1% |
| Standard Deviation (Sample) | 3.0% | 8.7% |
| Standard Deviation (Population) | 3.0% | 8.6% |
Demographics Similar to Immigrants from Micronesia and Cree by Single Mother Households
In terms of single mother households, the demographic groups most similar to Immigrants from Micronesia are Immigrants from Bangladesh (6.9%, a difference of 0.050%), French American Indian (6.9%, a difference of 0.070%), Immigrants from Sudan (6.9%, a difference of 0.12%), Immigrants from Thailand (6.9%, a difference of 0.26%), and Immigrants (6.8%, a difference of 0.45%). Similarly, the demographic groups most similar to Cree are Immigrants from Fiji (6.7%, a difference of 0.020%), German Russian (6.7%, a difference of 0.080%), Immigrants from South America (6.7%, a difference of 0.080%), Vietnamese (6.7%, a difference of 0.14%), and Immigrants from Colombia (6.7%, a difference of 0.35%).
| Demographics | Rating | Rank | Single Mother Households |
| Immigrants | Fiji | 11.9 /100 | #204 | Poor 6.7% |
| Cree | 11.9 /100 | #205 | Poor 6.7% |
| German Russians | 11.5 /100 | #206 | Poor 6.7% |
| Immigrants | South America | 11.5 /100 | #207 | Poor 6.7% |
| Vietnamese | 11.3 /100 | #208 | Poor 6.7% |
| Immigrants | Colombia | 10.5 /100 | #209 | Poor 6.7% |
| Immigrants | Nonimmigrants | 10.4 /100 | #210 | Poor 6.7% |
| Immigrants | Venezuela | 8.5 /100 | #211 | Tragic 6.7% |
| Immigrants | Eritrea | 8.4 /100 | #212 | Tragic 6.7% |
| Immigrants | Costa Rica | 8.2 /100 | #213 | Tragic 6.7% |
| Immigrants | Uruguay | 7.9 /100 | #214 | Tragic 6.7% |
| Shoshone | 5.7 /100 | #215 | Tragic 6.8% |
| Cherokee | 5.1 /100 | #216 | Tragic 6.8% |
| Aleuts | 4.8 /100 | #217 | Tragic 6.8% |
| Immigrants | Eastern Africa | 4.4 /100 | #218 | Tragic 6.8% |
| Immigrants | Immigrants | 4.3 /100 | #219 | Tragic 6.8% |
| Immigrants | Thailand | 4.0 /100 | #220 | Tragic 6.9% |
| French American Indians | 3.7 /100 | #221 | Tragic 6.9% |
| Immigrants | Bangladesh | 3.7 /100 | #222 | Tragic 6.9% |
| Immigrants | Micronesia | 3.6 /100 | #223 | Tragic 6.9% |
| Immigrants | Sudan | 3.5 /100 | #224 | Tragic 6.9% |