Dominican vs Immigrants from Yemen Single Mother Households
COMPARE
Dominican
Immigrants from Yemen
Single Mother Households
Single Mother Households Comparison
Dominicans
Immigrants from Yemen
9.2%
SINGLE MOTHER HOUSEHOLDS
0.0/ 100
METRIC RATING
343rd/ 347
METRIC RANK
7.4%
SINGLE MOTHER HOUSEHOLDS
0.2/ 100
METRIC RATING
259th/ 347
METRIC RANK
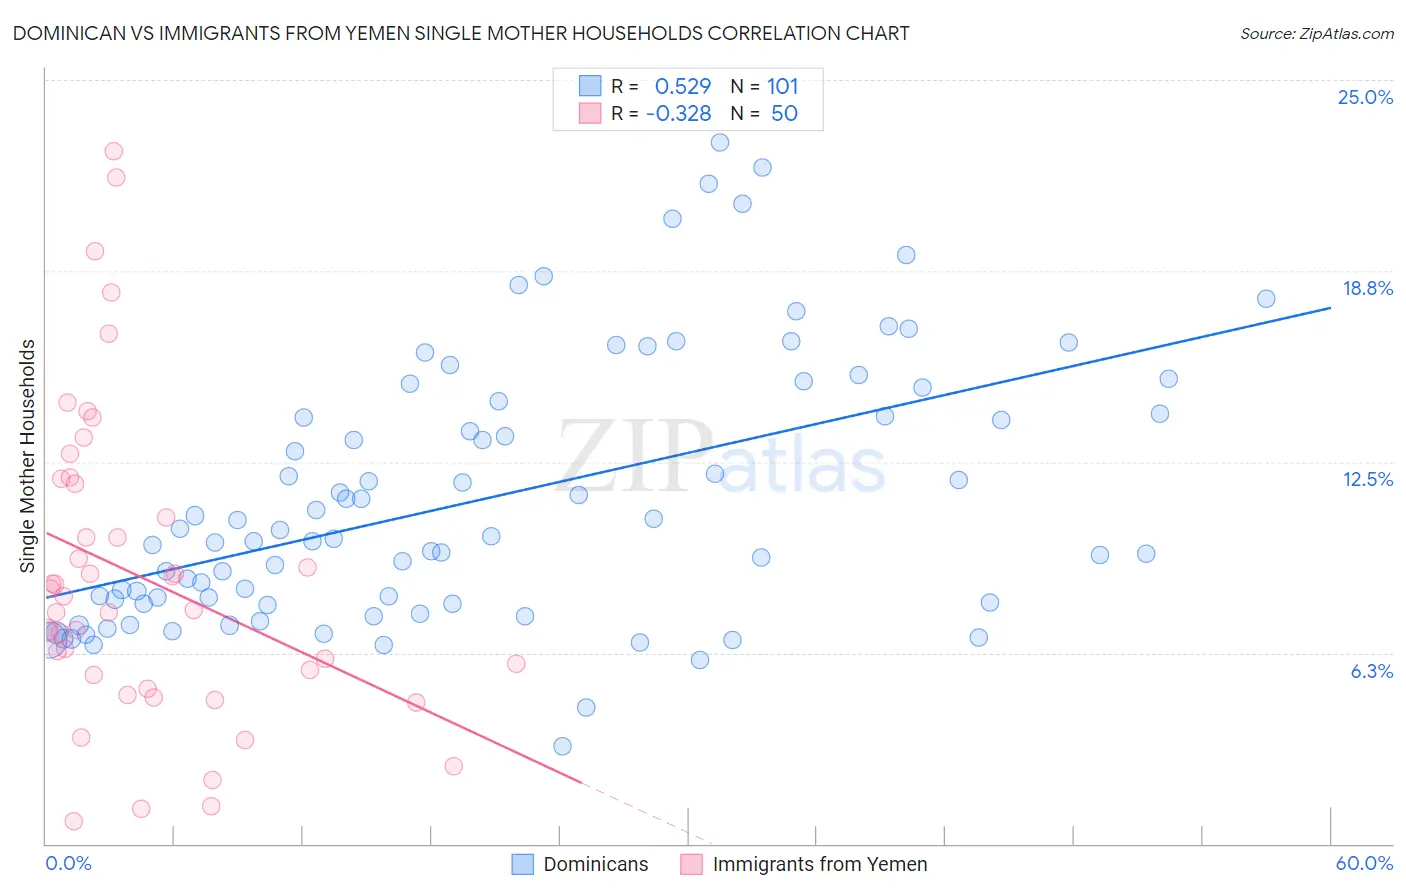
Dominican vs Immigrants from Yemen Single Mother Households Correlation Chart
The statistical analysis conducted on geographies consisting of 354,173,305 people shows a substantial positive correlation between the proportion of Dominicans and percentage of single mother households in the United States with a correlation coefficient (R) of 0.529 and weighted average of 9.2%. Similarly, the statistical analysis conducted on geographies consisting of 82,424,194 people shows a mild negative correlation between the proportion of Immigrants from Yemen and percentage of single mother households in the United States with a correlation coefficient (R) of -0.328 and weighted average of 7.4%, a difference of 24.1%.
Single Mother Households Correlation Summary
| Measurement | Dominican | Immigrants from Yemen |
| Minimum | 3.2% | 0.75% |
| Maximum | 23.0% | 22.7% |
| Range | 19.8% | 21.9% |
| Mean | 11.3% | 8.7% |
| Median | 10.0% | 7.9% |
| Interquartile 25% (IQ1) | 7.9% | 5.5% |
| Interquartile 75% (IQ3) | 14.3% | 11.8% |
| Interquartile Range (IQR) | 6.4% | 6.3% |
| Standard Deviation (Sample) | 4.3% | 5.1% |
| Standard Deviation (Population) | 4.3% | 5.0% |
Similar Demographics by Single Mother Households
Demographics Similar to Dominicans by Single Mother Households
In terms of single mother households, the demographic groups most similar to Dominicans are Menominee (9.2%, a difference of 0.21%), Tohono O'odham (9.1%, a difference of 0.53%), Lumbee (9.1%, a difference of 0.89%), Black/African American (9.0%, a difference of 2.1%), and Immigrants from Dominican Republic (9.5%, a difference of 3.5%).
| Demographics | Rating | Rank | Single Mother Households |
| Liberians | 0.0 /100 | #333 | Tragic 8.6% |
| Immigrants | Liberia | 0.0 /100 | #334 | Tragic 8.7% |
| Immigrants | Dominica | 0.0 /100 | #335 | Tragic 8.7% |
| Puerto Ricans | 0.0 /100 | #336 | Tragic 8.7% |
| Navajo | 0.0 /100 | #337 | Tragic 8.8% |
| Cape Verdeans | 0.0 /100 | #338 | Tragic 8.9% |
| Blacks/African Americans | 0.0 /100 | #339 | Tragic 9.0% |
| Lumbee | 0.0 /100 | #340 | Tragic 9.1% |
| Tohono O'odham | 0.0 /100 | #341 | Tragic 9.1% |
| Menominee | 0.0 /100 | #342 | Tragic 9.2% |
| Dominicans | 0.0 /100 | #343 | Tragic 9.2% |
| Immigrants | Dominican Republic | 0.0 /100 | #344 | Tragic 9.5% |
| Immigrants | Cabo Verde | 0.0 /100 | #345 | Tragic 9.6% |
| Yuman | 0.0 /100 | #346 | Tragic 9.6% |
| Yup'ik | 0.0 /100 | #347 | Tragic 10.0% |
Demographics Similar to Immigrants from Yemen by Single Mother Households
In terms of single mother households, the demographic groups most similar to Immigrants from Yemen are Pueblo (7.4%, a difference of 0.020%), Alaska Native (7.4%, a difference of 0.040%), Immigrants from Zaire (7.4%, a difference of 0.040%), Japanese (7.4%, a difference of 0.060%), and Seminole (7.4%, a difference of 0.080%).
| Demographics | Rating | Rank | Single Mother Households |
| Alaskan Athabascans | 0.3 /100 | #252 | Tragic 7.3% |
| Cajuns | 0.3 /100 | #253 | Tragic 7.3% |
| Immigrants | Ecuador | 0.3 /100 | #254 | Tragic 7.3% |
| Mexican American Indians | 0.2 /100 | #255 | Tragic 7.4% |
| Seminole | 0.2 /100 | #256 | Tragic 7.4% |
| Alaska Natives | 0.2 /100 | #257 | Tragic 7.4% |
| Pueblo | 0.2 /100 | #258 | Tragic 7.4% |
| Immigrants | Yemen | 0.2 /100 | #259 | Tragic 7.4% |
| Immigrants | Zaire | 0.2 /100 | #260 | Tragic 7.4% |
| Japanese | 0.2 /100 | #261 | Tragic 7.4% |
| Immigrants | Somalia | 0.2 /100 | #262 | Tragic 7.4% |
| Immigrants | Nicaragua | 0.2 /100 | #263 | Tragic 7.4% |
| Yaqui | 0.1 /100 | #264 | Tragic 7.4% |
| Crow | 0.1 /100 | #265 | Tragic 7.4% |
| Nepalese | 0.1 /100 | #266 | Tragic 7.5% |