Immigrants from Eastern Africa vs Yup'ik Family Households with Children
COMPARE
Immigrants from Eastern Africa
Yup'ik
Family Households with Children
Family Households with Children Comparison
Immigrants from Eastern Africa
Yup'ik
27.7%
FAMILY HOUSEHOLDS WITH CHILDREN
80.2/ 100
METRIC RATING
143rd/ 347
METRIC RANK
37.0%
FAMILY HOUSEHOLDS WITH CHILDREN
100/ 100
METRIC RATING
1st/ 347
METRIC RANK
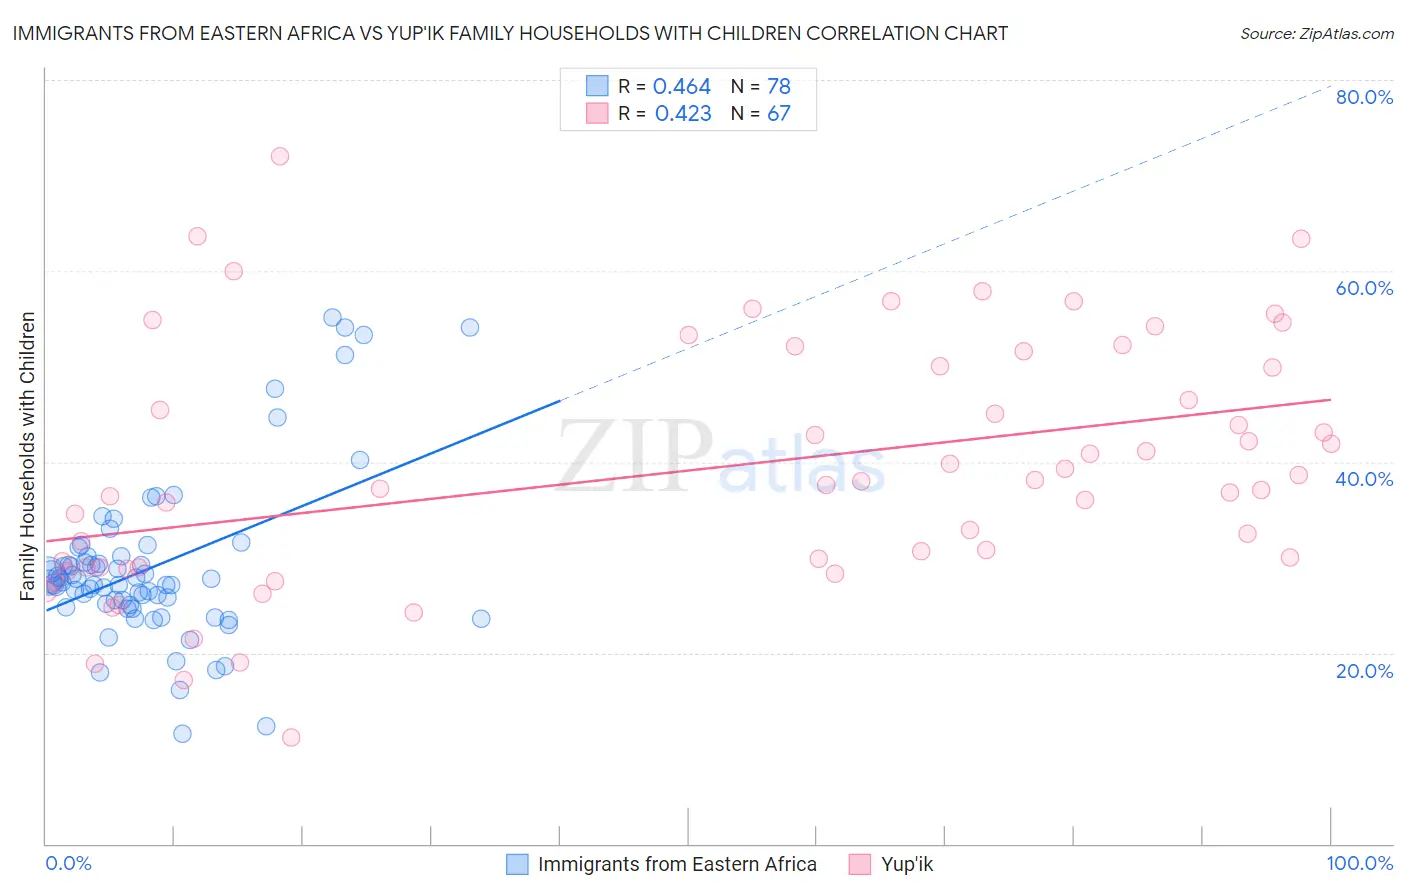
Immigrants from Eastern Africa vs Yup'ik Family Households with Children Correlation Chart
The statistical analysis conducted on geographies consisting of 354,810,617 people shows a moderate positive correlation between the proportion of Immigrants from Eastern Africa and percentage of family households with children in the United States with a correlation coefficient (R) of 0.464 and weighted average of 27.7%. Similarly, the statistical analysis conducted on geographies consisting of 39,956,617 people shows a moderate positive correlation between the proportion of Yup'ik and percentage of family households with children in the United States with a correlation coefficient (R) of 0.423 and weighted average of 37.0%, a difference of 33.8%.
Family Households with Children Correlation Summary
| Measurement | Immigrants from Eastern Africa | Yup'ik |
| Minimum | 11.5% | 11.1% |
| Maximum | 55.1% | 72.0% |
| Range | 43.6% | 60.9% |
| Mean | 29.0% | 39.1% |
| Median | 27.3% | 37.6% |
| Interquartile 25% (IQ1) | 25.0% | 28.9% |
| Interquartile 75% (IQ3) | 30.1% | 50.0% |
| Interquartile Range (IQR) | 5.1% | 21.1% |
| Standard Deviation (Sample) | 8.6% | 12.9% |
| Standard Deviation (Population) | 8.6% | 12.8% |
Similar Demographics by Family Households with Children
Demographics Similar to Immigrants from Eastern Africa by Family Households with Children
In terms of family households with children, the demographic groups most similar to Immigrants from Eastern Africa are Brazilian (27.7%, a difference of 0.020%), Immigrants from Chile (27.7%, a difference of 0.030%), Basque (27.7%, a difference of 0.030%), Swiss (27.7%, a difference of 0.040%), and Immigrants from Moldova (27.6%, a difference of 0.040%).
| Demographics | Rating | Rank | Family Households with Children |
| Immigrants | Portugal | 84.1 /100 | #136 | Excellent 27.7% |
| Immigrants | Dominican Republic | 83.9 /100 | #137 | Excellent 27.7% |
| Uruguayans | 83.2 /100 | #138 | Excellent 27.7% |
| Vietnamese | 82.6 /100 | #139 | Excellent 27.7% |
| Spanish | 81.8 /100 | #140 | Excellent 27.7% |
| Immigrants | Eastern Asia | 81.7 /100 | #141 | Excellent 27.7% |
| Swiss | 81.4 /100 | #142 | Excellent 27.7% |
| Immigrants | Eastern Africa | 80.2 /100 | #143 | Excellent 27.7% |
| Brazilians | 79.6 /100 | #144 | Good 27.7% |
| Immigrants | Chile | 79.5 /100 | #145 | Good 27.7% |
| Basques | 79.5 /100 | #146 | Good 27.7% |
| Immigrants | Moldova | 79.1 /100 | #147 | Good 27.6% |
| Osage | 79.0 /100 | #148 | Good 27.6% |
| Menominee | 78.9 /100 | #149 | Good 27.6% |
| Argentineans | 78.5 /100 | #150 | Good 27.6% |
Demographics Similar to Yup'ik by Family Households with Children
In terms of family households with children, the demographic groups most similar to Yup'ik are Inupiat (32.8%, a difference of 12.7%), Immigrants from Mexico (31.6%, a difference of 17.1%), Mexican (31.4%, a difference of 18.0%), Tongan (31.2%, a difference of 18.5%), and Immigrants from India (31.0%, a difference of 19.2%).
| Demographics | Rating | Rank | Family Households with Children |
| Yup'ik | 100 /100 | #1 | Exceptional 37.0% |
| Inupiat | 100 /100 | #2 | Exceptional 32.8% |
| Immigrants | Mexico | 100.0 /100 | #3 | Exceptional 31.6% |
| Mexicans | 100.0 /100 | #4 | Exceptional 31.4% |
| Tongans | 100.0 /100 | #5 | Exceptional 31.2% |
| Immigrants | India | 100.0 /100 | #6 | Exceptional 31.0% |
| Immigrants | Central America | 100.0 /100 | #7 | Exceptional 31.0% |
| Yakama | 100.0 /100 | #8 | Exceptional 30.8% |
| Thais | 100.0 /100 | #9 | Exceptional 30.6% |
| Immigrants | Fiji | 100.0 /100 | #10 | Exceptional 30.5% |
| Nepalese | 100.0 /100 | #11 | Exceptional 30.5% |
| Immigrants | Pakistan | 100.0 /100 | #12 | Exceptional 30.2% |
| Afghans | 100.0 /100 | #13 | Exceptional 30.2% |
| Bangladeshis | 100.0 /100 | #14 | Exceptional 30.1% |
| Immigrants | South Central Asia | 100.0 /100 | #15 | Exceptional 30.0% |