German vs Immigrants from Somalia Family Households with Children
COMPARE
German
Immigrants from Somalia
Family Households with Children
Family Households with Children Comparison
Germans
Immigrants from Somalia
27.1%
FAMILY HOUSEHOLDS WITH CHILDREN
8.7/ 100
METRIC RATING
224th/ 347
METRIC RANK
26.3%
FAMILY HOUSEHOLDS WITH CHILDREN
0.0/ 100
METRIC RATING
309th/ 347
METRIC RANK
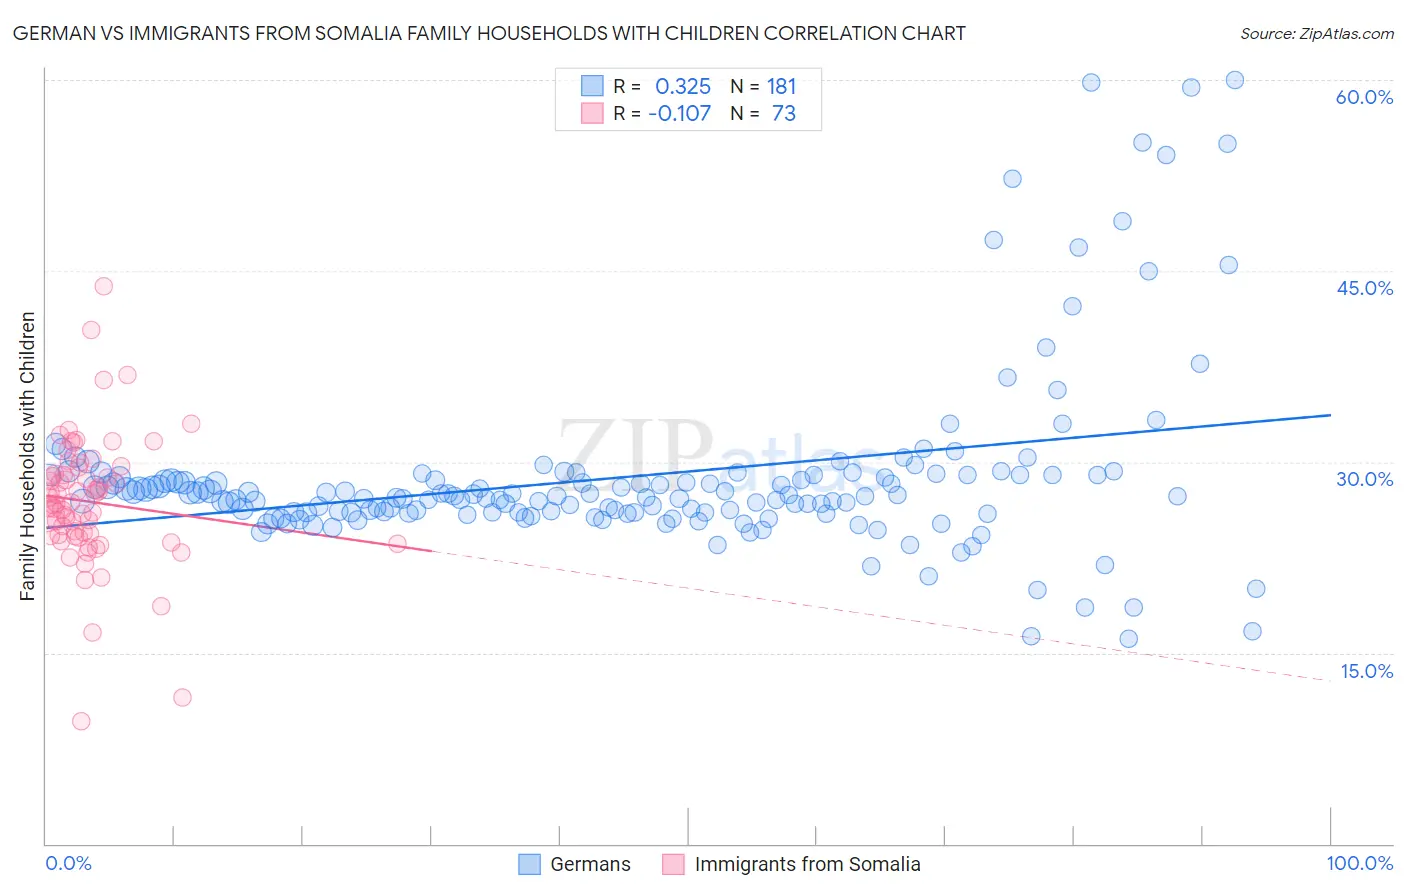
German vs Immigrants from Somalia Family Households with Children Correlation Chart
The statistical analysis conducted on geographies consisting of 579,972,630 people shows a mild positive correlation between the proportion of Germans and percentage of family households with children in the United States with a correlation coefficient (R) of 0.325 and weighted average of 27.1%. Similarly, the statistical analysis conducted on geographies consisting of 92,093,079 people shows a poor negative correlation between the proportion of Immigrants from Somalia and percentage of family households with children in the United States with a correlation coefficient (R) of -0.107 and weighted average of 26.3%, a difference of 3.2%.
Family Households with Children Correlation Summary
| Measurement | German | Immigrants from Somalia |
| Minimum | 16.1% | 9.6% |
| Maximum | 60.0% | 43.8% |
| Range | 43.9% | 34.2% |
| Mean | 28.8% | 26.9% |
| Median | 27.3% | 26.7% |
| Interquartile 25% (IQ1) | 26.0% | 24.2% |
| Interquartile 75% (IQ3) | 29.0% | 29.3% |
| Interquartile Range (IQR) | 3.0% | 5.1% |
| Standard Deviation (Sample) | 7.2% | 5.2% |
| Standard Deviation (Population) | 7.2% | 5.2% |
Similar Demographics by Family Households with Children
Demographics Similar to Germans by Family Households with Children
In terms of family households with children, the demographic groups most similar to Germans are Pima (27.1%, a difference of 0.030%), Paraguayan (27.1%, a difference of 0.050%), New Zealander (27.1%, a difference of 0.060%), Austrian (27.1%, a difference of 0.080%), and Canadian (27.1%, a difference of 0.090%).
| Demographics | Rating | Rank | Family Households with Children |
| U.S. Virgin Islanders | 12.1 /100 | #217 | Poor 27.1% |
| Greeks | 11.4 /100 | #218 | Poor 27.1% |
| Immigrants | Japan | 10.7 /100 | #219 | Poor 27.1% |
| Austrians | 9.9 /100 | #220 | Tragic 27.1% |
| New Zealanders | 9.6 /100 | #221 | Tragic 27.1% |
| Paraguayans | 9.4 /100 | #222 | Tragic 27.1% |
| Pima | 9.2 /100 | #223 | Tragic 27.1% |
| Germans | 8.7 /100 | #224 | Tragic 27.1% |
| Canadians | 7.5 /100 | #225 | Tragic 27.1% |
| Czechoslovakians | 6.6 /100 | #226 | Tragic 27.0% |
| Tsimshian | 6.6 /100 | #227 | Tragic 27.0% |
| Scottish | 6.5 /100 | #228 | Tragic 27.0% |
| Immigrants | Caribbean | 6.3 /100 | #229 | Tragic 27.0% |
| Bulgarians | 5.8 /100 | #230 | Tragic 27.0% |
| Luxembourgers | 5.5 /100 | #231 | Tragic 27.0% |
Demographics Similar to Immigrants from Somalia by Family Households with Children
In terms of family households with children, the demographic groups most similar to Immigrants from Somalia are Marshallese (26.2%, a difference of 0.050%), Colville (26.2%, a difference of 0.090%), Lumbee (26.3%, a difference of 0.11%), West Indian (26.3%, a difference of 0.13%), and Immigrants from Czechoslovakia (26.2%, a difference of 0.16%).
| Demographics | Rating | Rank | Family Households with Children |
| Serbians | 0.1 /100 | #302 | Tragic 26.4% |
| Immigrants | Guyana | 0.1 /100 | #303 | Tragic 26.3% |
| Immigrants | Bahamas | 0.1 /100 | #304 | Tragic 26.3% |
| Guyanese | 0.1 /100 | #305 | Tragic 26.3% |
| Bermudans | 0.1 /100 | #306 | Tragic 26.3% |
| West Indians | 0.0 /100 | #307 | Tragic 26.3% |
| Lumbee | 0.0 /100 | #308 | Tragic 26.3% |
| Immigrants | Somalia | 0.0 /100 | #309 | Tragic 26.3% |
| Marshallese | 0.0 /100 | #310 | Tragic 26.2% |
| Colville | 0.0 /100 | #311 | Tragic 26.2% |
| Immigrants | Czechoslovakia | 0.0 /100 | #312 | Tragic 26.2% |
| Cree | 0.0 /100 | #313 | Tragic 26.2% |
| French Canadians | 0.0 /100 | #314 | Tragic 26.1% |
| Immigrants | Norway | 0.0 /100 | #315 | Tragic 26.1% |
| Estonians | 0.0 /100 | #316 | Tragic 26.1% |