Crow vs Immigrants from Czechoslovakia Average Family Size
COMPARE
Crow
Immigrants from Czechoslovakia
Average Family Size
Average Family Size Comparison
Crow
Immigrants from Czechoslovakia
3.82
AVERAGE FAMILY SIZE
100/ 100
METRIC RATING
2nd/ 347
METRIC RANK
3.14
AVERAGE FAMILY SIZE
0.3/ 100
METRIC RATING
288th/ 347
METRIC RANK
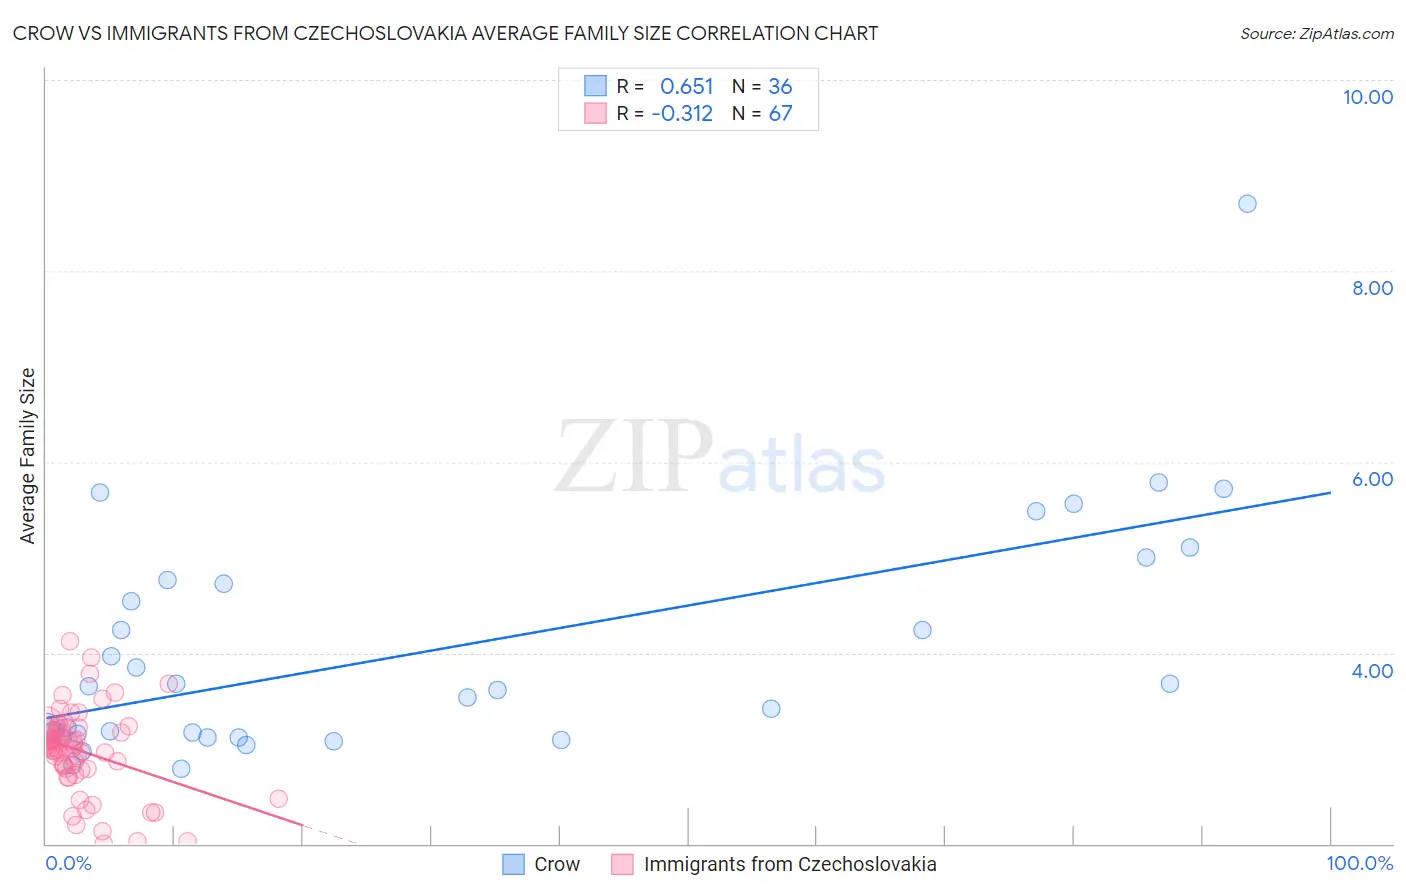
Crow vs Immigrants from Czechoslovakia Average Family Size Correlation Chart
The statistical analysis conducted on geographies consisting of 59,202,817 people shows a significant positive correlation between the proportion of Crow and average family size in the United States with a correlation coefficient (R) of 0.651 and weighted average of 3.82. Similarly, the statistical analysis conducted on geographies consisting of 195,446,712 people shows a mild negative correlation between the proportion of Immigrants from Czechoslovakia and average family size in the United States with a correlation coefficient (R) of -0.312 and weighted average of 3.14, a difference of 21.7%.
Average Family Size Correlation Summary
| Measurement | Crow | Immigrants from Czechoslovakia |
| Minimum | 2.78 | 2.00 |
| Maximum | 8.70 | 4.12 |
| Range | 5.92 | 2.12 |
| Mean | 4.03 | 2.97 |
| Median | 3.63 | 3.01 |
| Interquartile 25% (IQ1) | 3.13 | 2.79 |
| Interquartile 75% (IQ3) | 4.74 | 3.21 |
| Interquartile Range (IQR) | 1.61 | 0.42 |
| Standard Deviation (Sample) | 1.23 | 0.44 |
| Standard Deviation (Population) | 1.22 | 0.44 |
Similar Demographics by Average Family Size
Demographics Similar to Crow by Average Family Size
In terms of average family size, the demographic groups most similar to Crow are Pueblo (3.79, a difference of 0.81%), Pima (3.75, a difference of 2.1%), Yup'ik (4.00, a difference of 4.5%), Navajo (3.65, a difference of 4.9%), and Arapaho (3.64, a difference of 5.2%).
| Demographics | Rating | Rank | Average Family Size |
| Yup'ik | 100 /100 | #1 | Exceptional 4.00 |
| Crow | 100 /100 | #2 | Exceptional 3.82 |
| Pueblo | 100 /100 | #3 | Exceptional 3.79 |
| Pima | 100 /100 | #4 | Exceptional 3.75 |
| Navajo | 100.0 /100 | #5 | Exceptional 3.65 |
| Arapaho | 100.0 /100 | #6 | Exceptional 3.64 |
| Inupiat | 100.0 /100 | #7 | Exceptional 3.63 |
| Immigrants | Yemen | 100.0 /100 | #8 | Exceptional 3.60 |
| Hopi | 100.0 /100 | #9 | Exceptional 3.60 |
| Spanish American Indians | 100.0 /100 | #10 | Exceptional 3.58 |
| Tohono O'odham | 100.0 /100 | #11 | Exceptional 3.53 |
| Immigrants | Mexico | 100.0 /100 | #12 | Exceptional 3.52 |
| Sioux | 100.0 /100 | #13 | Exceptional 3.52 |
| Immigrants | Central America | 100.0 /100 | #14 | Exceptional 3.49 |
| Tongans | 100.0 /100 | #15 | Exceptional 3.49 |
Demographics Similar to Immigrants from Czechoslovakia by Average Family Size
In terms of average family size, the demographic groups most similar to Immigrants from Czechoslovakia are Greek (3.14, a difference of 0.0%), Immigrants from Norway (3.14, a difference of 0.0%), Immigrants from Netherlands (3.14, a difference of 0.010%), Cypriot (3.14, a difference of 0.030%), and White/Caucasian (3.14, a difference of 0.060%).
| Demographics | Rating | Rank | Average Family Size |
| Immigrants | Denmark | 0.4 /100 | #281 | Tragic 3.15 |
| Yugoslavians | 0.4 /100 | #282 | Tragic 3.15 |
| German Russians | 0.4 /100 | #283 | Tragic 3.15 |
| Immigrants | France | 0.4 /100 | #284 | Tragic 3.15 |
| Whites/Caucasians | 0.3 /100 | #285 | Tragic 3.14 |
| Immigrants | Netherlands | 0.3 /100 | #286 | Tragic 3.14 |
| Greeks | 0.3 /100 | #287 | Tragic 3.14 |
| Immigrants | Czechoslovakia | 0.3 /100 | #288 | Tragic 3.14 |
| Immigrants | Norway | 0.3 /100 | #289 | Tragic 3.14 |
| Cypriots | 0.3 /100 | #290 | Tragic 3.14 |
| Alsatians | 0.2 /100 | #291 | Tragic 3.14 |
| Europeans | 0.2 /100 | #292 | Tragic 3.14 |
| Scandinavians | 0.2 /100 | #293 | Tragic 3.14 |
| Immigrants | Croatia | 0.2 /100 | #294 | Tragic 3.14 |
| Austrians | 0.2 /100 | #295 | Tragic 3.14 |