Immigrants from Latin America vs Immigrants from Western Africa Divorced or Separated
COMPARE
Immigrants from Latin America
Immigrants from Western Africa
Divorced or Separated
Divorced or Separated Comparison
Immigrants from Latin America
Immigrants from Western Africa
12.4%
DIVORCED OR SEPARATED
2.8/ 100
METRIC RATING
243rd/ 347
METRIC RANK
12.3%
DIVORCED OR SEPARATED
9.3/ 100
METRIC RATING
226th/ 347
METRIC RANK
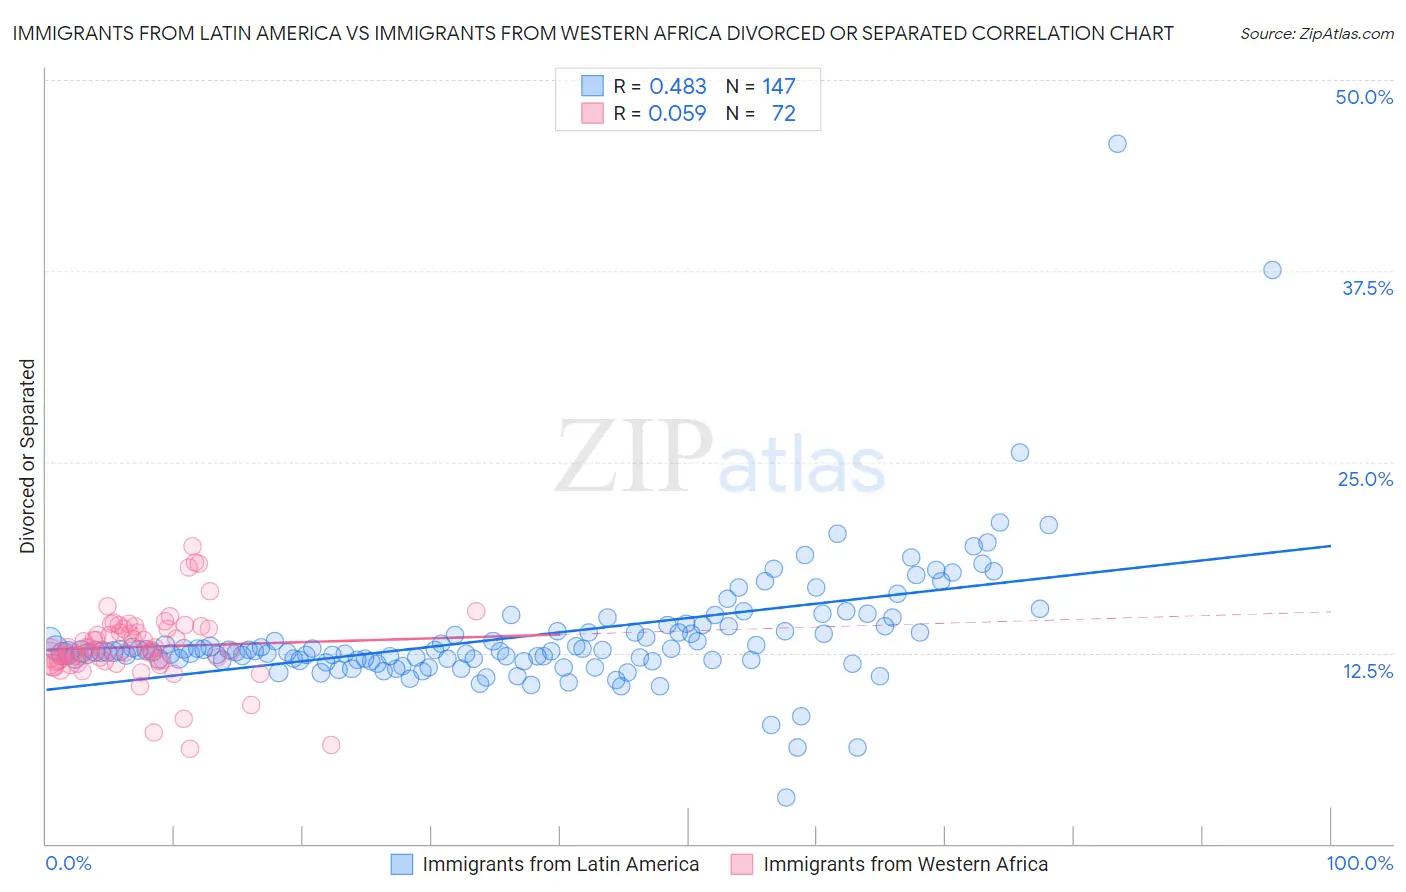
Immigrants from Latin America vs Immigrants from Western Africa Divorced or Separated Correlation Chart
The statistical analysis conducted on geographies consisting of 558,222,982 people shows a moderate positive correlation between the proportion of Immigrants from Latin America and percentage of population currently divorced or separated in the United States with a correlation coefficient (R) of 0.483 and weighted average of 12.4%. Similarly, the statistical analysis conducted on geographies consisting of 357,656,491 people shows a slight positive correlation between the proportion of Immigrants from Western Africa and percentage of population currently divorced or separated in the United States with a correlation coefficient (R) of 0.059 and weighted average of 12.3%, a difference of 1.1%.
Divorced or Separated Correlation Summary
| Measurement | Immigrants from Latin America | Immigrants from Western Africa |
| Minimum | 3.0% | 6.2% |
| Maximum | 45.8% | 19.5% |
| Range | 42.8% | 13.3% |
| Mean | 13.6% | 12.9% |
| Median | 12.6% | 12.7% |
| Interquartile 25% (IQ1) | 12.0% | 11.9% |
| Interquartile 75% (IQ3) | 13.9% | 14.1% |
| Interquartile Range (IQR) | 1.9% | 2.2% |
| Standard Deviation (Sample) | 4.3% | 2.3% |
| Standard Deviation (Population) | 4.3% | 2.3% |
Demographics Similar to Immigrants from Latin America and Immigrants from Western Africa by Divorced or Separated
In terms of divorced or separated, the demographic groups most similar to Immigrants from Latin America are Dutch (12.4%, a difference of 0.070%), Alaska Native (12.4%, a difference of 0.10%), Uruguayan (12.4%, a difference of 0.15%), British West Indian (12.4%, a difference of 0.24%), and Immigrants from Germany (12.4%, a difference of 0.29%). Similarly, the demographic groups most similar to Immigrants from Western Africa are Belgian (12.3%, a difference of 0.030%), Immigrants from the Azores (12.3%, a difference of 0.040%), Hmong (12.3%, a difference of 0.050%), Immigrants from Cameroon (12.3%, a difference of 0.10%), and Immigrants from Sudan (12.3%, a difference of 0.12%).
| Demographics | Rating | Rank | Divorced or Separated |
| Immigrants | Azores | 9.7 /100 | #224 | Tragic 12.3% |
| Belgians | 9.7 /100 | #225 | Tragic 12.3% |
| Immigrants | Western Africa | 9.3 /100 | #226 | Tragic 12.3% |
| Hmong | 8.8 /100 | #227 | Tragic 12.3% |
| Immigrants | Cameroon | 8.3 /100 | #228 | Tragic 12.3% |
| Immigrants | Sudan | 8.2 /100 | #229 | Tragic 12.3% |
| Yakama | 7.8 /100 | #230 | Tragic 12.3% |
| Yugoslavians | 6.6 /100 | #231 | Tragic 12.3% |
| Canadians | 5.3 /100 | #232 | Tragic 12.4% |
| Malaysians | 4.8 /100 | #233 | Tragic 12.4% |
| West Indians | 4.4 /100 | #234 | Tragic 12.4% |
| Immigrants | Bosnia and Herzegovina | 4.3 /100 | #235 | Tragic 12.4% |
| Colombians | 4.2 /100 | #236 | Tragic 12.4% |
| Immigrants | Laos | 4.2 /100 | #237 | Tragic 12.4% |
| Sudanese | 4.0 /100 | #238 | Tragic 12.4% |
| Immigrants | Germany | 4.0 /100 | #239 | Tragic 12.4% |
| British West Indians | 3.7 /100 | #240 | Tragic 12.4% |
| Uruguayans | 3.4 /100 | #241 | Tragic 12.4% |
| Dutch | 3.1 /100 | #242 | Tragic 12.4% |
| Immigrants | Latin America | 2.8 /100 | #243 | Tragic 12.4% |
| Alaska Natives | 2.5 /100 | #244 | Tragic 12.4% |