Chinese vs Immigrants from Dominica Births to Unmarried Women
COMPARE
Chinese
Immigrants from Dominica
Births to Unmarried Women
Births to Unmarried Women Comparison
Chinese
Immigrants from Dominica
30.2%
BIRTHS TO UNMARRIED WOMEN
87.1/ 100
METRIC RATING
127th/ 347
METRIC RANK
39.5%
BIRTHS TO UNMARRIED WOMEN
0.0/ 100
METRIC RATING
310th/ 347
METRIC RANK
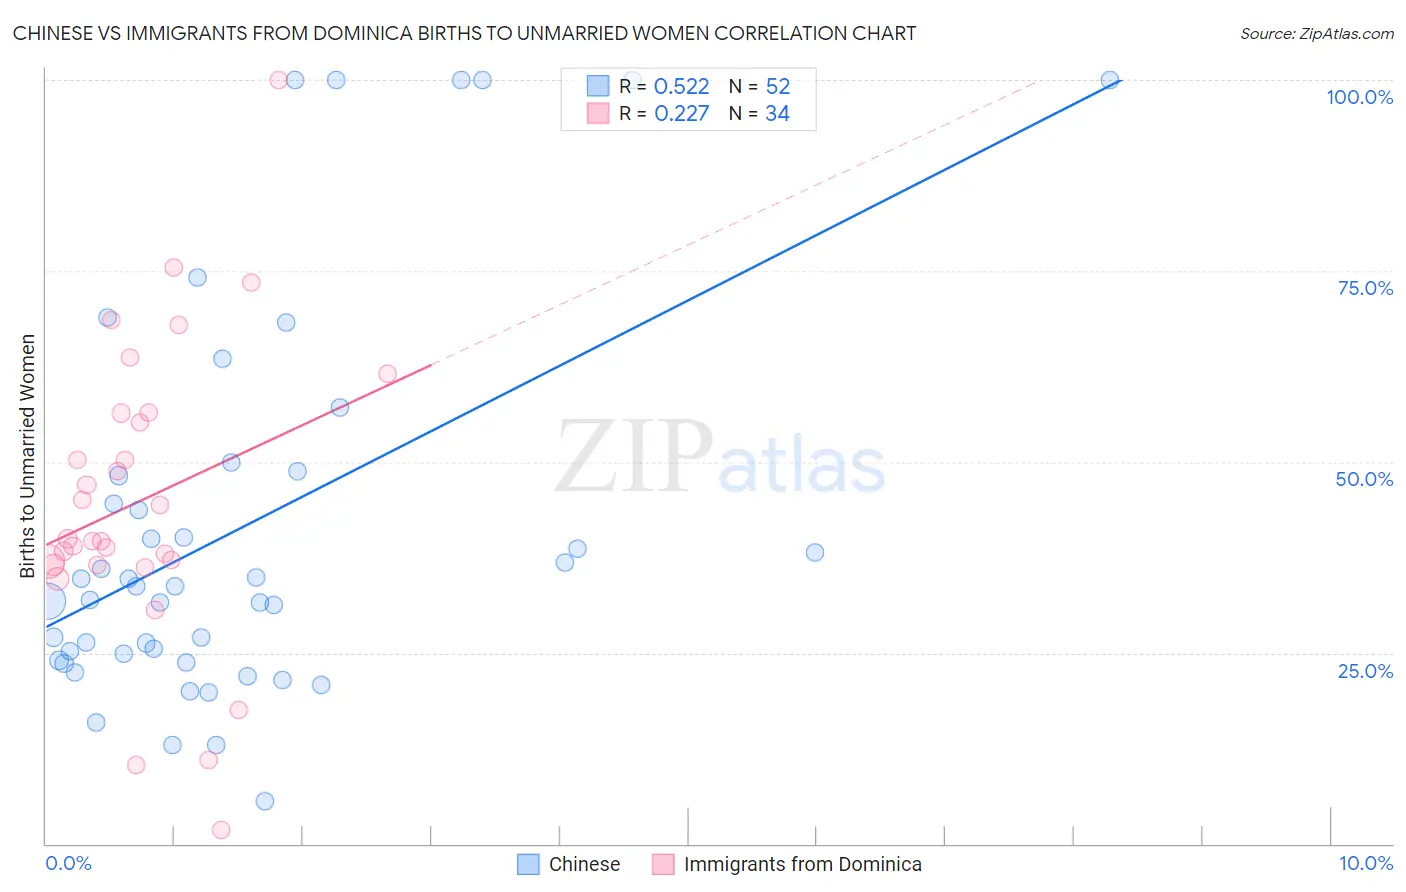
Chinese vs Immigrants from Dominica Births to Unmarried Women Correlation Chart
The statistical analysis conducted on geographies consisting of 63,513,648 people shows a substantial positive correlation between the proportion of Chinese and percentage of births to unmarried women in the United States with a correlation coefficient (R) of 0.522 and weighted average of 30.2%. Similarly, the statistical analysis conducted on geographies consisting of 82,693,898 people shows a weak positive correlation between the proportion of Immigrants from Dominica and percentage of births to unmarried women in the United States with a correlation coefficient (R) of 0.227 and weighted average of 39.5%, a difference of 30.5%.
Births to Unmarried Women Correlation Summary
| Measurement | Chinese | Immigrants from Dominica |
| Minimum | 5.5% | 1.8% |
| Maximum | 100.0% | 100.0% |
| Range | 94.5% | 98.2% |
| Mean | 41.4% | 44.9% |
| Median | 33.7% | 39.8% |
| Interquartile 25% (IQ1) | 24.5% | 36.5% |
| Interquartile 75% (IQ3) | 48.5% | 56.4% |
| Interquartile Range (IQR) | 24.0% | 19.9% |
| Standard Deviation (Sample) | 25.6% | 19.7% |
| Standard Deviation (Population) | 25.4% | 19.4% |
Similar Demographics by Births to Unmarried Women
Demographics Similar to Chinese by Births to Unmarried Women
In terms of births to unmarried women, the demographic groups most similar to Chinese are European (30.2%, a difference of 0.030%), Vietnamese (30.2%, a difference of 0.14%), Croatian (30.2%, a difference of 0.22%), Icelander (30.3%, a difference of 0.24%), and Syrian (30.2%, a difference of 0.25%).
| Demographics | Rating | Rank | Births to Unmarried Women |
| Ugandans | 89.2 /100 | #120 | Excellent 30.1% |
| Koreans | 88.9 /100 | #121 | Excellent 30.1% |
| Immigrants | Argentina | 88.7 /100 | #122 | Excellent 30.1% |
| Syrians | 88.2 /100 | #123 | Excellent 30.2% |
| Croatians | 88.0 /100 | #124 | Excellent 30.2% |
| Vietnamese | 87.7 /100 | #125 | Excellent 30.2% |
| Europeans | 87.2 /100 | #126 | Excellent 30.2% |
| Chinese | 87.1 /100 | #127 | Excellent 30.2% |
| Icelanders | 86.0 /100 | #128 | Excellent 30.3% |
| Immigrants | Spain | 85.8 /100 | #129 | Excellent 30.3% |
| Immigrants | Bosnia and Herzegovina | 85.7 /100 | #130 | Excellent 30.3% |
| Immigrants | Zimbabwe | 85.7 /100 | #131 | Excellent 30.3% |
| New Zealanders | 85.5 /100 | #132 | Excellent 30.3% |
| Immigrants | Morocco | 85.2 /100 | #133 | Excellent 30.4% |
| Immigrants | South Eastern Asia | 85.2 /100 | #134 | Excellent 30.4% |
Demographics Similar to Immigrants from Dominica by Births to Unmarried Women
In terms of births to unmarried women, the demographic groups most similar to Immigrants from Dominica are Cuban (39.4%, a difference of 0.22%), Immigrants from the Azores (39.6%, a difference of 0.23%), U.S. Virgin Islander (39.6%, a difference of 0.25%), Aleut (39.3%, a difference of 0.34%), and Immigrants from Honduras (39.3%, a difference of 0.43%).
| Demographics | Rating | Rank | Births to Unmarried Women |
| Immigrants | Jamaica | 0.0 /100 | #303 | Tragic 38.8% |
| Yaqui | 0.0 /100 | #304 | Tragic 38.8% |
| Immigrants | Haiti | 0.0 /100 | #305 | Tragic 38.9% |
| Central American Indians | 0.0 /100 | #306 | Tragic 39.0% |
| Immigrants | Honduras | 0.0 /100 | #307 | Tragic 39.3% |
| Aleuts | 0.0 /100 | #308 | Tragic 39.3% |
| Cubans | 0.0 /100 | #309 | Tragic 39.4% |
| Immigrants | Dominica | 0.0 /100 | #310 | Tragic 39.5% |
| Immigrants | Azores | 0.0 /100 | #311 | Tragic 39.6% |
| U.S. Virgin Islanders | 0.0 /100 | #312 | Tragic 39.6% |
| Africans | 0.0 /100 | #313 | Tragic 39.7% |
| Immigrants | Caribbean | 0.0 /100 | #314 | Tragic 39.8% |
| Dominicans | 0.0 /100 | #315 | Tragic 39.8% |
| Apache | 0.0 /100 | #316 | Tragic 39.9% |
| Immigrants | Dominican Republic | 0.0 /100 | #317 | Tragic 40.1% |