Celtic vs Senegalese Married-couple Households
COMPARE
Celtic
Senegalese
Married-couple Households
Married-couple Households Comparison
Celtics
Senegalese
47.3%
MARRIED-COUPLE HOUSEHOLDS
88.1/ 100
METRIC RATING
127th/ 347
METRIC RANK
38.6%
MARRIED-COUPLE HOUSEHOLDS
0.0/ 100
METRIC RATING
335th/ 347
METRIC RANK
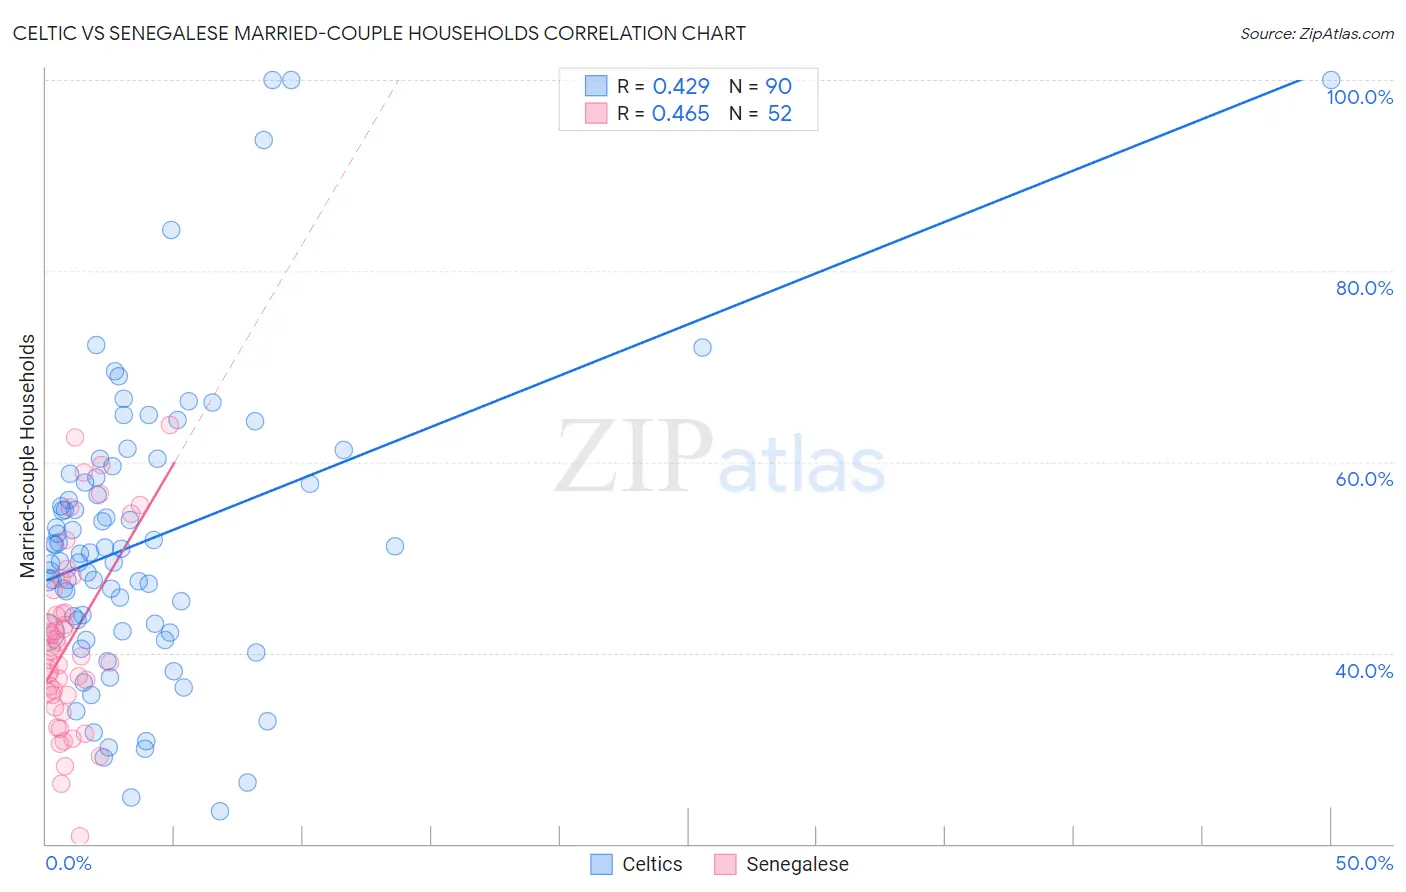
Celtic vs Senegalese Married-couple Households Correlation Chart
The statistical analysis conducted on geographies consisting of 168,846,519 people shows a moderate positive correlation between the proportion of Celtics and percentage of married-couple family households in the United States with a correlation coefficient (R) of 0.429 and weighted average of 47.3%. Similarly, the statistical analysis conducted on geographies consisting of 78,113,781 people shows a moderate positive correlation between the proportion of Senegalese and percentage of married-couple family households in the United States with a correlation coefficient (R) of 0.465 and weighted average of 38.6%, a difference of 22.7%.
Married-couple Households Correlation Summary
| Measurement | Celtic | Senegalese |
| Minimum | 23.4% | 20.8% |
| Maximum | 100.0% | 63.9% |
| Range | 76.6% | 43.0% |
| Mean | 51.8% | 41.2% |
| Median | 50.4% | 39.9% |
| Interquartile 25% (IQ1) | 42.3% | 35.6% |
| Interquartile 75% (IQ3) | 58.3% | 45.5% |
| Interquartile Range (IQR) | 16.1% | 9.8% |
| Standard Deviation (Sample) | 15.3% | 9.5% |
| Standard Deviation (Population) | 15.3% | 9.4% |
Similar Demographics by Married-couple Households
Demographics Similar to Celtics by Married-couple Households
In terms of married-couple households, the demographic groups most similar to Celtics are Immigrants from Peru (47.3%, a difference of 0.020%), Immigrants from Iraq (47.3%, a difference of 0.030%), Immigrants from Hungary (47.3%, a difference of 0.030%), Pakistani (47.3%, a difference of 0.040%), and Immigrants from Denmark (47.3%, a difference of 0.050%).
| Demographics | Rating | Rank | Married-couple Households |
| Puget Sound Salish | 90.5 /100 | #120 | Exceptional 47.4% |
| Immigrants | Eastern Europe | 90.3 /100 | #121 | Exceptional 47.4% |
| Okinawans | 90.1 /100 | #122 | Exceptional 47.4% |
| Immigrants | Venezuela | 89.3 /100 | #123 | Excellent 47.4% |
| Zimbabweans | 89.2 /100 | #124 | Excellent 47.4% |
| Australians | 89.0 /100 | #125 | Excellent 47.4% |
| Pakistanis | 88.6 /100 | #126 | Excellent 47.3% |
| Celtics | 88.1 /100 | #127 | Excellent 47.3% |
| Immigrants | Peru | 87.9 /100 | #128 | Excellent 47.3% |
| Immigrants | Iraq | 87.8 /100 | #129 | Excellent 47.3% |
| Immigrants | Hungary | 87.8 /100 | #130 | Excellent 47.3% |
| Immigrants | Denmark | 87.5 /100 | #131 | Excellent 47.3% |
| Immigrants | Ukraine | 86.7 /100 | #132 | Excellent 47.3% |
| South Africans | 86.4 /100 | #133 | Excellent 47.3% |
| Immigrants | Greece | 86.0 /100 | #134 | Excellent 47.2% |
Demographics Similar to Senegalese by Married-couple Households
In terms of married-couple households, the demographic groups most similar to Senegalese are Black/African American (38.5%, a difference of 0.18%), Immigrants from Somalia (38.4%, a difference of 0.32%), Immigrants from St. Vincent and the Grenadines (38.7%, a difference of 0.33%), Immigrants from Senegal (38.4%, a difference of 0.48%), and British West Indian (38.3%, a difference of 0.61%).
| Demographics | Rating | Rank | Married-couple Households |
| Barbadians | 0.0 /100 | #328 | Tragic 39.4% |
| Immigrants | Dominica | 0.0 /100 | #329 | Tragic 39.4% |
| Immigrants | Barbados | 0.0 /100 | #330 | Tragic 39.2% |
| Immigrants | Congo | 0.0 /100 | #331 | Tragic 39.0% |
| Somalis | 0.0 /100 | #332 | Tragic 39.0% |
| Immigrants | West Indies | 0.0 /100 | #333 | Tragic 39.0% |
| Immigrants | St. Vincent and the Grenadines | 0.0 /100 | #334 | Tragic 38.7% |
| Senegalese | 0.0 /100 | #335 | Tragic 38.6% |
| Blacks/African Americans | 0.0 /100 | #336 | Tragic 38.5% |
| Immigrants | Somalia | 0.0 /100 | #337 | Tragic 38.4% |
| Immigrants | Senegal | 0.0 /100 | #338 | Tragic 38.4% |
| British West Indians | 0.0 /100 | #339 | Tragic 38.3% |
| Dominicans | 0.0 /100 | #340 | Tragic 38.2% |
| Cape Verdeans | 0.0 /100 | #341 | Tragic 38.1% |
| Tohono O'odham | 0.0 /100 | #342 | Tragic 37.9% |