Immigrants from Peru vs Indonesian Average Family Size
COMPARE
Immigrants from Peru
Indonesian
Average Family Size
Average Family Size Comparison
Immigrants from Peru
Indonesians
3.31
AVERAGE FAMILY SIZE
99.7/ 100
METRIC RATING
87th/ 347
METRIC RANK
3.28
AVERAGE FAMILY SIZE
96.2/ 100
METRIC RATING
111th/ 347
METRIC RANK
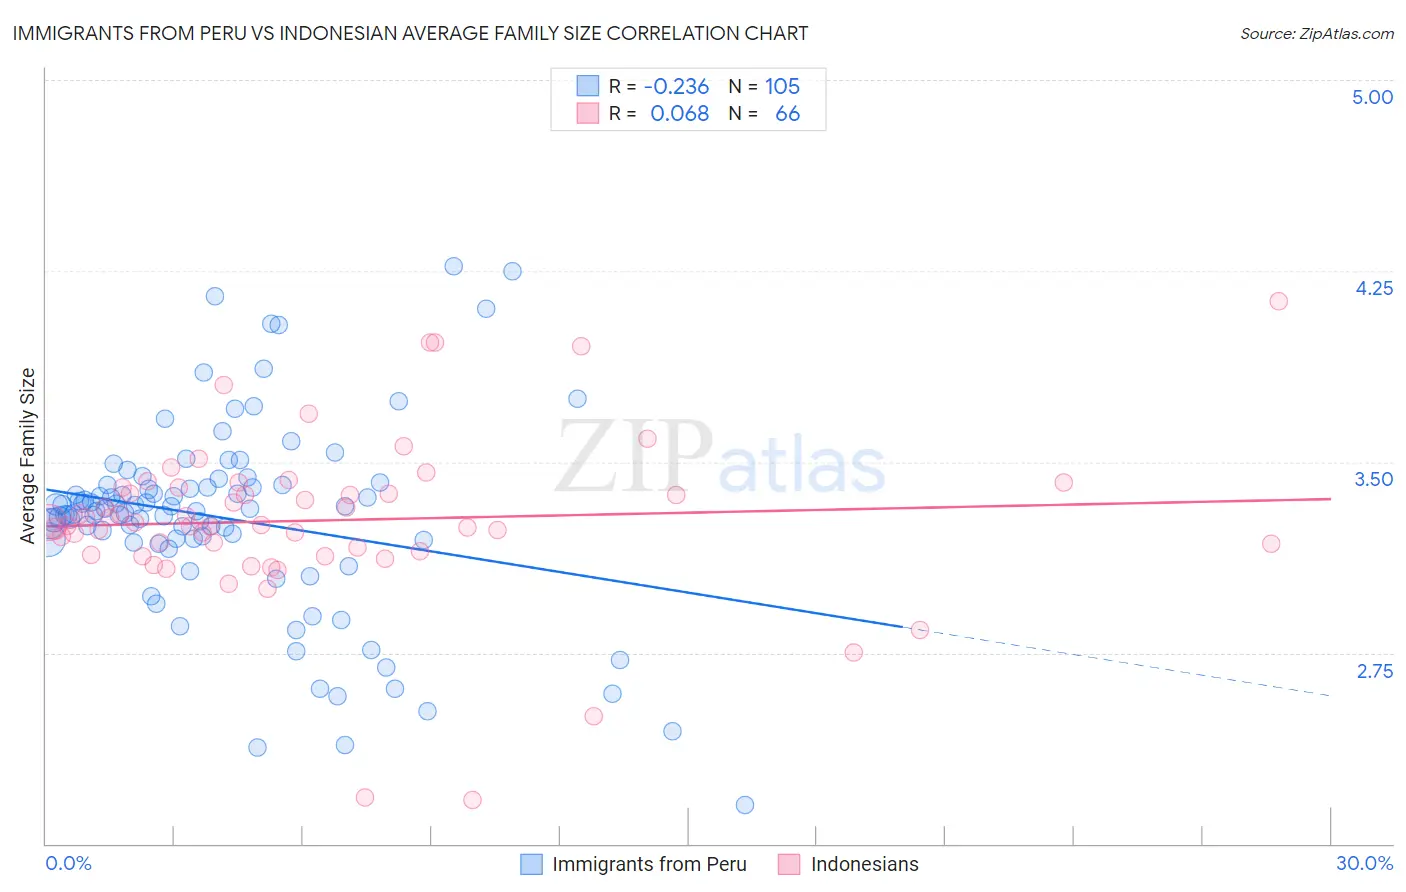
Immigrants from Peru vs Indonesian Average Family Size Correlation Chart
The statistical analysis conducted on geographies consisting of 328,761,601 people shows a weak negative correlation between the proportion of Immigrants from Peru and average family size in the United States with a correlation coefficient (R) of -0.236 and weighted average of 3.31. Similarly, the statistical analysis conducted on geographies consisting of 162,608,656 people shows a slight positive correlation between the proportion of Indonesians and average family size in the United States with a correlation coefficient (R) of 0.068 and weighted average of 3.28, a difference of 1.1%.
Average Family Size Correlation Summary
| Measurement | Immigrants from Peru | Indonesian |
| Minimum | 2.15 | 2.17 |
| Maximum | 4.27 | 4.13 |
| Range | 2.12 | 1.96 |
| Mean | 3.28 | 3.27 |
| Median | 3.31 | 3.25 |
| Interquartile 25% (IQ1) | 3.19 | 3.15 |
| Interquartile 75% (IQ3) | 3.41 | 3.40 |
| Interquartile Range (IQR) | 0.22 | 0.25 |
| Standard Deviation (Sample) | 0.38 | 0.33 |
| Standard Deviation (Population) | 0.38 | 0.33 |
Similar Demographics by Average Family Size
Demographics Similar to Immigrants from Peru by Average Family Size
In terms of average family size, the demographic groups most similar to Immigrants from Peru are Jamaican (3.31, a difference of 0.050%), Afghan (3.31, a difference of 0.070%), Immigrants from Bolivia (3.31, a difference of 0.090%), Malaysian (3.31, a difference of 0.10%), and Immigrants from Nigeria (3.32, a difference of 0.12%).
| Demographics | Rating | Rank | Average Family Size |
| Lumbee | 99.8 /100 | #80 | Exceptional 3.32 |
| Immigrants | Dominica | 99.8 /100 | #81 | Exceptional 3.32 |
| Ecuadorians | 99.8 /100 | #82 | Exceptional 3.32 |
| Immigrants | Afghanistan | 99.8 /100 | #83 | Exceptional 3.32 |
| Immigrants | Nigeria | 99.7 /100 | #84 | Exceptional 3.32 |
| Afghans | 99.7 /100 | #85 | Exceptional 3.31 |
| Jamaicans | 99.7 /100 | #86 | Exceptional 3.31 |
| Immigrants | Peru | 99.7 /100 | #87 | Exceptional 3.31 |
| Immigrants | Bolivia | 99.6 /100 | #88 | Exceptional 3.31 |
| Malaysians | 99.6 /100 | #89 | Exceptional 3.31 |
| Menominee | 99.4 /100 | #90 | Exceptional 3.30 |
| Immigrants | Pakistan | 99.2 /100 | #91 | Exceptional 3.30 |
| Immigrants | Cameroon | 99.2 /100 | #92 | Exceptional 3.30 |
| Peruvians | 99.2 /100 | #93 | Exceptional 3.30 |
| Sierra Leoneans | 99.0 /100 | #94 | Exceptional 3.30 |
Demographics Similar to Indonesians by Average Family Size
In terms of average family size, the demographic groups most similar to Indonesians are Bahamian (3.28, a difference of 0.050%), Puerto Rican (3.28, a difference of 0.060%), Black/African American (3.27, a difference of 0.060%), Immigrants from Panama (3.27, a difference of 0.070%), and Asian (3.28, a difference of 0.11%).
| Demographics | Rating | Rank | Average Family Size |
| Bolivians | 98.3 /100 | #104 | Exceptional 3.29 |
| Immigrants | Ghana | 98.1 /100 | #105 | Exceptional 3.29 |
| Paiute | 98.0 /100 | #106 | Exceptional 3.29 |
| Ghanaians | 98.0 /100 | #107 | Exceptional 3.29 |
| Asians | 97.0 /100 | #108 | Exceptional 3.28 |
| Puerto Ricans | 96.7 /100 | #109 | Exceptional 3.28 |
| Bahamians | 96.6 /100 | #110 | Exceptional 3.28 |
| Indonesians | 96.2 /100 | #111 | Exceptional 3.28 |
| Blacks/African Americans | 95.7 /100 | #112 | Exceptional 3.27 |
| Immigrants | Panama | 95.6 /100 | #113 | Exceptional 3.27 |
| South Americans | 95.1 /100 | #114 | Exceptional 3.27 |
| Immigrants | Liberia | 95.0 /100 | #115 | Exceptional 3.27 |
| Immigrants | South America | 95.0 /100 | #116 | Exceptional 3.27 |
| Kiowa | 94.8 /100 | #117 | Exceptional 3.27 |
| Immigrants | Asia | 94.0 /100 | #118 | Exceptional 3.27 |