Cape Verdean vs New Zealander Births to Unmarried Women
COMPARE
Cape Verdean
New Zealander
Births to Unmarried Women
Births to Unmarried Women Comparison
Cape Verdeans
New Zealanders
41.3%
BIRTHS TO UNMARRIED WOMEN
0.0/ 100
METRIC RATING
324th/ 347
METRIC RANK
30.3%
BIRTHS TO UNMARRIED WOMEN
85.5/ 100
METRIC RATING
132nd/ 347
METRIC RANK
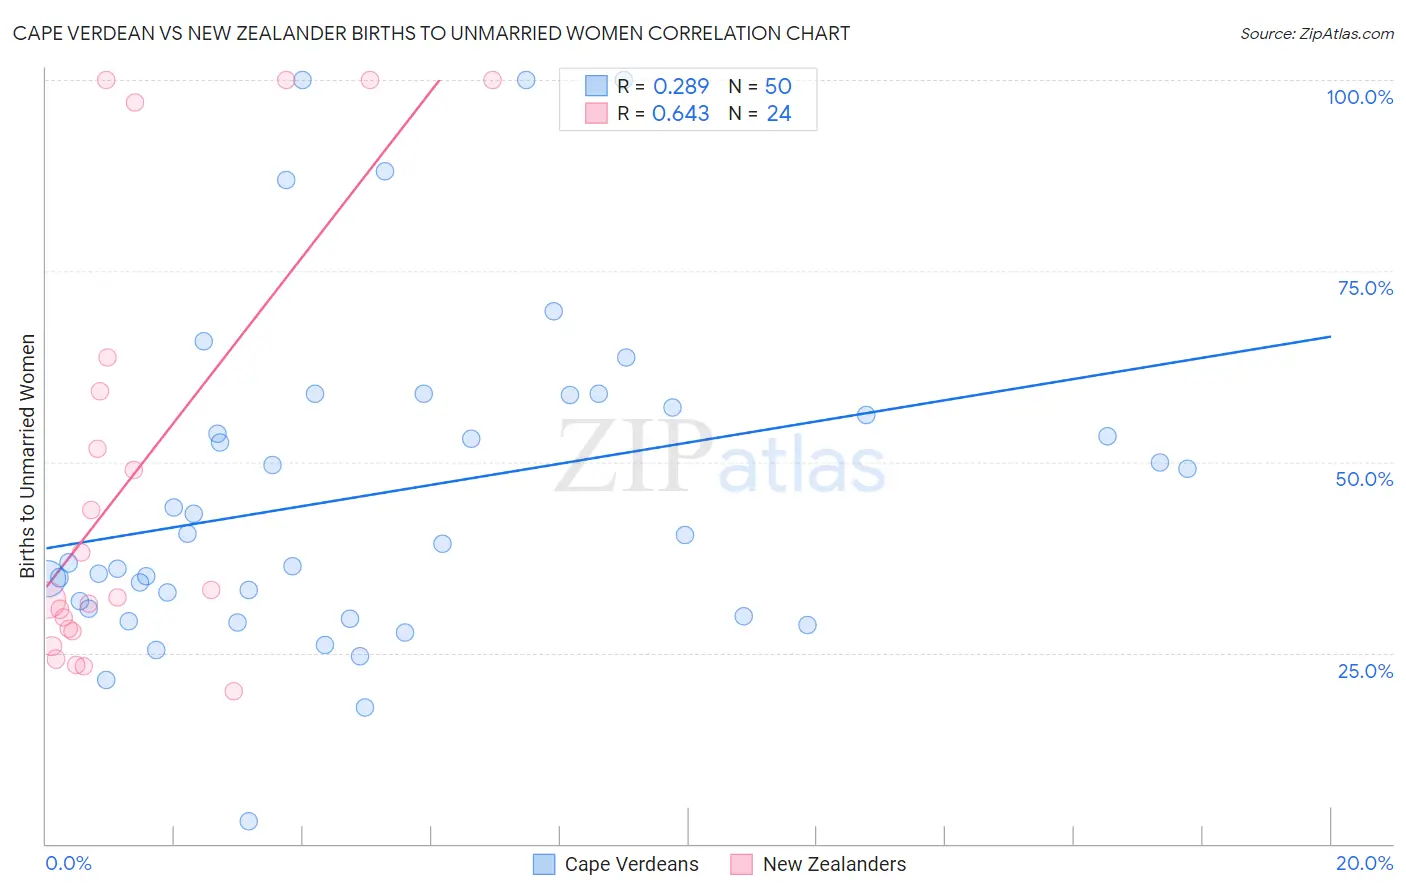
Cape Verdean vs New Zealander Births to Unmarried Women Correlation Chart
The statistical analysis conducted on geographies consisting of 104,600,290 people shows a weak positive correlation between the proportion of Cape Verdeans and percentage of births to unmarried women in the United States with a correlation coefficient (R) of 0.289 and weighted average of 41.3%. Similarly, the statistical analysis conducted on geographies consisting of 103,815,095 people shows a significant positive correlation between the proportion of New Zealanders and percentage of births to unmarried women in the United States with a correlation coefficient (R) of 0.643 and weighted average of 30.3%, a difference of 36.2%.
Births to Unmarried Women Correlation Summary
| Measurement | Cape Verdean | New Zealander |
| Minimum | 3.0% | 20.0% |
| Maximum | 100.0% | 100.0% |
| Range | 97.0% | 80.0% |
| Mean | 45.9% | 48.5% |
| Median | 39.8% | 32.8% |
| Interquartile 25% (IQ1) | 30.7% | 28.0% |
| Interquartile 75% (IQ3) | 57.2% | 61.5% |
| Interquartile Range (IQR) | 26.5% | 33.5% |
| Standard Deviation (Sample) | 21.5% | 28.9% |
| Standard Deviation (Population) | 21.3% | 28.3% |
Similar Demographics by Births to Unmarried Women
Demographics Similar to Cape Verdeans by Births to Unmarried Women
In terms of births to unmarried women, the demographic groups most similar to Cape Verdeans are Cheyenne (41.3%, a difference of 0.060%), Immigrants from Cuba (41.5%, a difference of 0.33%), Sioux (41.0%, a difference of 0.80%), Cajun (41.0%, a difference of 0.87%), and Bahamian (40.8%, a difference of 1.4%).
| Demographics | Rating | Rank | Births to Unmarried Women |
| Immigrants | Dominican Republic | 0.0 /100 | #317 | Tragic 40.1% |
| Immigrants | Bahamas | 0.0 /100 | #318 | Tragic 40.1% |
| Yakama | 0.0 /100 | #319 | Tragic 40.3% |
| Crow | 0.0 /100 | #320 | Tragic 40.4% |
| Bahamians | 0.0 /100 | #321 | Tragic 40.8% |
| Cajuns | 0.0 /100 | #322 | Tragic 41.0% |
| Sioux | 0.0 /100 | #323 | Tragic 41.0% |
| Cape Verdeans | 0.0 /100 | #324 | Tragic 41.3% |
| Cheyenne | 0.0 /100 | #325 | Tragic 41.3% |
| Immigrants | Cuba | 0.0 /100 | #326 | Tragic 41.5% |
| Tsimshian | 0.0 /100 | #327 | Tragic 42.2% |
| Immigrants | Cabo Verde | 0.0 /100 | #328 | Tragic 42.2% |
| Paiute | 0.0 /100 | #329 | Tragic 42.5% |
| Chippewa | 0.0 /100 | #330 | Tragic 42.6% |
| Natives/Alaskans | 0.0 /100 | #331 | Tragic 43.0% |
Demographics Similar to New Zealanders by Births to Unmarried Women
In terms of births to unmarried women, the demographic groups most similar to New Zealanders are Immigrants from Zimbabwe (30.3%, a difference of 0.030%), Immigrants from Bosnia and Herzegovina (30.3%, a difference of 0.050%), Immigrants from Morocco (30.4%, a difference of 0.050%), Immigrants from Spain (30.3%, a difference of 0.060%), and Immigrants from South Eastern Asia (30.4%, a difference of 0.060%).
| Demographics | Rating | Rank | Births to Unmarried Women |
| Vietnamese | 87.7 /100 | #125 | Excellent 30.2% |
| Europeans | 87.2 /100 | #126 | Excellent 30.2% |
| Chinese | 87.1 /100 | #127 | Excellent 30.2% |
| Icelanders | 86.0 /100 | #128 | Excellent 30.3% |
| Immigrants | Spain | 85.8 /100 | #129 | Excellent 30.3% |
| Immigrants | Bosnia and Herzegovina | 85.7 /100 | #130 | Excellent 30.3% |
| Immigrants | Zimbabwe | 85.7 /100 | #131 | Excellent 30.3% |
| New Zealanders | 85.5 /100 | #132 | Excellent 30.3% |
| Immigrants | Morocco | 85.2 /100 | #133 | Excellent 30.4% |
| Immigrants | South Eastern Asia | 85.2 /100 | #134 | Excellent 30.4% |
| Brazilians | 84.8 /100 | #135 | Excellent 30.4% |
| Immigrants | Scotland | 84.6 /100 | #136 | Excellent 30.4% |
| Immigrants | Philippines | 83.9 /100 | #137 | Excellent 30.4% |
| Puget Sound Salish | 83.9 /100 | #138 | Excellent 30.4% |
| Immigrants | Canada | 83.7 /100 | #139 | Excellent 30.4% |