Cajun vs Italian Currently Married
COMPARE
Cajun
Italian
Currently Married
Currently Married Comparison
Cajuns
Italians
47.1%
CURRENTLY MARRIED
75.3/ 100
METRIC RATING
140th/ 347
METRIC RANK
48.8%
CURRENTLY MARRIED
99.4/ 100
METRIC RATING
36th/ 347
METRIC RANK
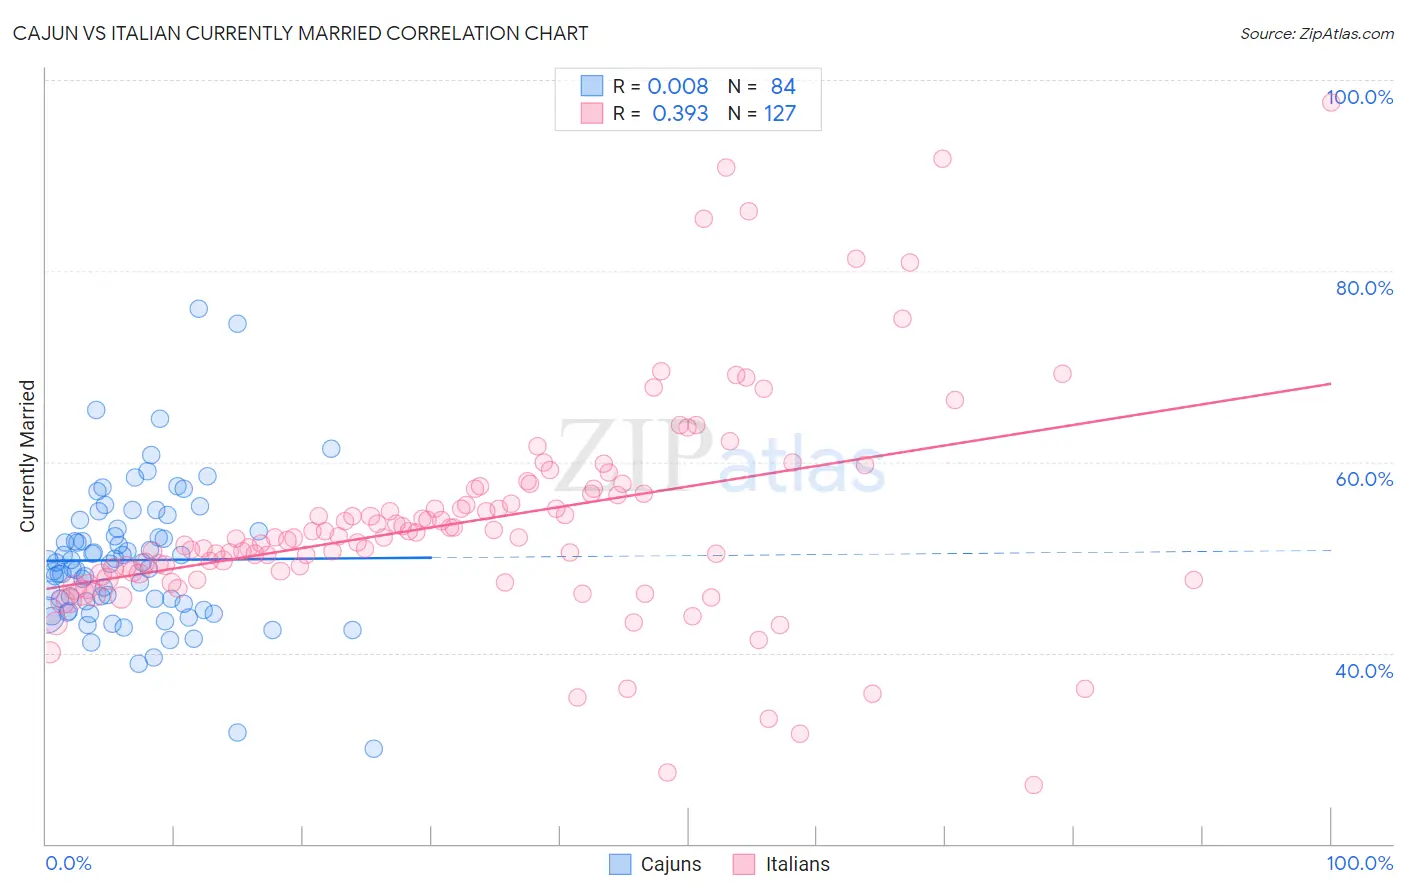
Cajun vs Italian Currently Married Correlation Chart
The statistical analysis conducted on geographies consisting of 149,704,790 people shows no correlation between the proportion of Cajuns and percentage of population currently married in the United States with a correlation coefficient (R) of 0.008 and weighted average of 47.1%. Similarly, the statistical analysis conducted on geographies consisting of 574,980,657 people shows a mild positive correlation between the proportion of Italians and percentage of population currently married in the United States with a correlation coefficient (R) of 0.393 and weighted average of 48.8%, a difference of 3.6%.
Currently Married Correlation Summary
| Measurement | Cajun | Italian |
| Minimum | 29.9% | 26.2% |
| Maximum | 76.1% | 97.6% |
| Range | 46.2% | 71.5% |
| Mean | 49.7% | 53.8% |
| Median | 49.4% | 52.1% |
| Interquartile 25% (IQ1) | 44.9% | 48.3% |
| Interquartile 75% (IQ3) | 52.9% | 57.2% |
| Interquartile Range (IQR) | 8.0% | 8.8% |
| Standard Deviation (Sample) | 7.5% | 11.5% |
| Standard Deviation (Population) | 7.4% | 11.5% |
Similar Demographics by Currently Married
Demographics Similar to Cajuns by Currently Married
In terms of currently married, the demographic groups most similar to Cajuns are Venezuelan (47.1%, a difference of 0.040%), Argentinean (47.1%, a difference of 0.040%), Guamanian/Chamorro (47.1%, a difference of 0.050%), Hmong (47.1%, a difference of 0.090%), and Pakistani (47.2%, a difference of 0.11%).
| Demographics | Rating | Rank | Currently Married |
| Immigrants | Malaysia | 81.1 /100 | #133 | Excellent 47.3% |
| Immigrants | Australia | 81.1 /100 | #134 | Excellent 47.3% |
| Immigrants | Norway | 79.7 /100 | #135 | Good 47.2% |
| Immigrants | Vietnam | 78.2 /100 | #136 | Good 47.2% |
| Paraguayans | 77.8 /100 | #137 | Good 47.2% |
| Pakistanis | 77.5 /100 | #138 | Good 47.2% |
| Yugoslavians | 77.4 /100 | #139 | Good 47.2% |
| Cajuns | 75.3 /100 | #140 | Good 47.1% |
| Venezuelans | 74.4 /100 | #141 | Good 47.1% |
| Argentineans | 74.4 /100 | #142 | Good 47.1% |
| Guamanians/Chamorros | 74.2 /100 | #143 | Good 47.1% |
| Hmong | 73.4 /100 | #144 | Good 47.1% |
| Immigrants | South Eastern Asia | 72.9 /100 | #145 | Good 47.1% |
| Carpatho Rusyns | 72.6 /100 | #146 | Good 47.0% |
| Immigrants | Argentina | 72.0 /100 | #147 | Good 47.0% |
Demographics Similar to Italians by Currently Married
In terms of currently married, the demographic groups most similar to Italians are Hungarian (48.8%, a difference of 0.0%), Immigrants from Northern Europe (48.8%, a difference of 0.010%), Immigrants from Lithuania (48.8%, a difference of 0.030%), Czechoslovakian (48.8%, a difference of 0.040%), and British (48.8%, a difference of 0.070%).
| Demographics | Rating | Rank | Currently Married |
| Croatians | 99.5 /100 | #29 | Exceptional 48.9% |
| Eastern Europeans | 99.5 /100 | #30 | Exceptional 48.9% |
| Poles | 99.5 /100 | #31 | Exceptional 48.9% |
| Immigrants | Hong Kong | 99.5 /100 | #32 | Exceptional 48.9% |
| Irish | 99.5 /100 | #33 | Exceptional 48.9% |
| Immigrants | Lithuania | 99.4 /100 | #34 | Exceptional 48.8% |
| Immigrants | Northern Europe | 99.4 /100 | #35 | Exceptional 48.8% |
| Italians | 99.4 /100 | #36 | Exceptional 48.8% |
| Hungarians | 99.4 /100 | #37 | Exceptional 48.8% |
| Czechoslovakians | 99.4 /100 | #38 | Exceptional 48.8% |
| British | 99.4 /100 | #39 | Exceptional 48.8% |
| Immigrants | Canada | 99.4 /100 | #40 | Exceptional 48.8% |
| Greeks | 99.3 /100 | #41 | Exceptional 48.8% |
| Finns | 99.3 /100 | #42 | Exceptional 48.8% |
| Scotch-Irish | 99.3 /100 | #43 | Exceptional 48.7% |