Immigrants from Cambodia vs Immigrants from Norway Single Mother Households
COMPARE
Immigrants from Cambodia
Immigrants from Norway
Single Mother Households
Single Mother Households Comparison
Immigrants from Cambodia
Immigrants from Norway
7.2%
SINGLE MOTHER HOUSEHOLDS
0.5/ 100
METRIC RATING
245th/ 347
METRIC RANK
5.6%
SINGLE MOTHER HOUSEHOLDS
98.7/ 100
METRIC RATING
60th/ 347
METRIC RANK
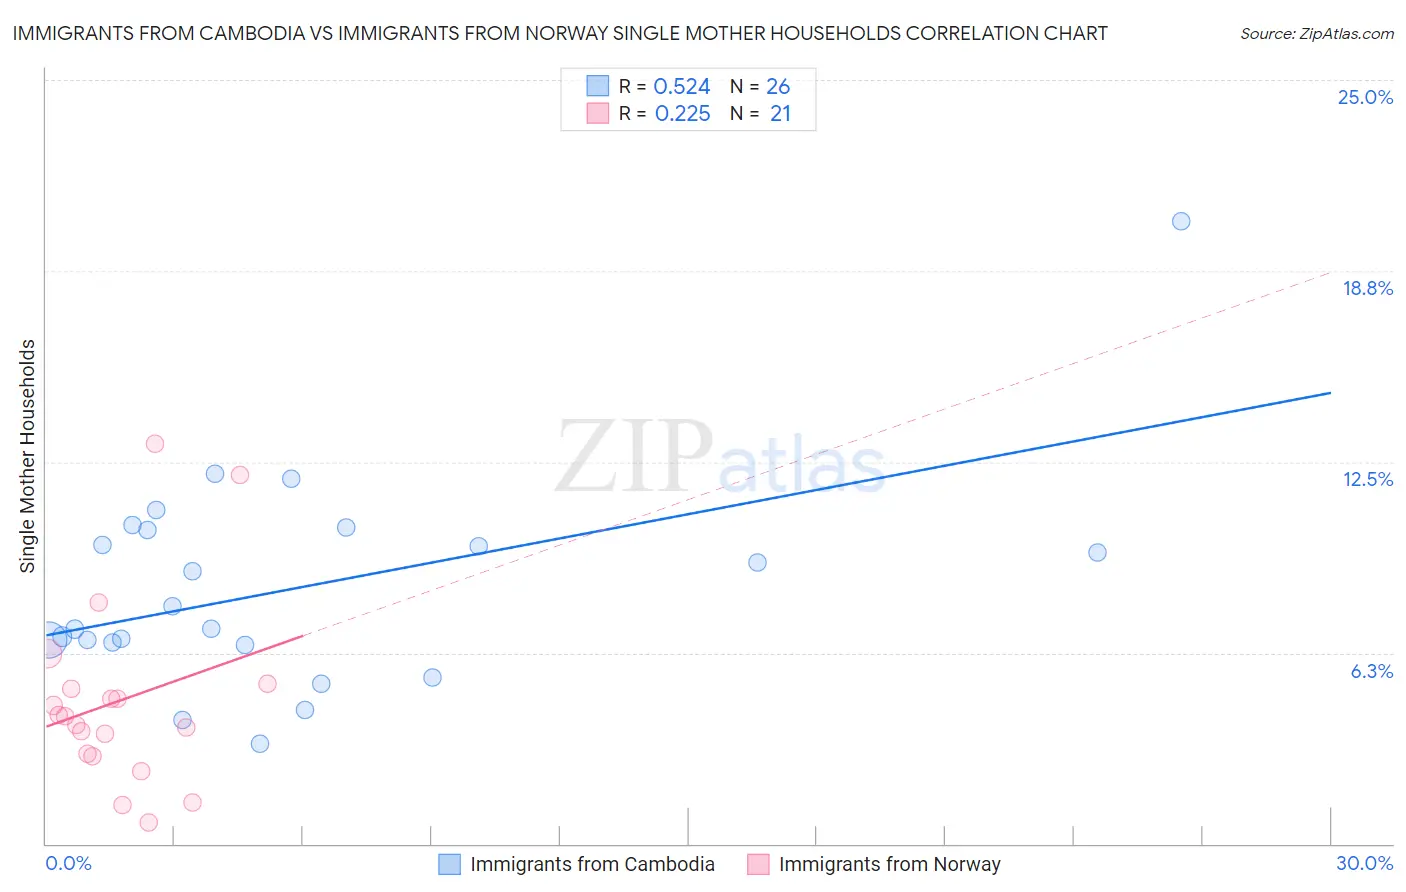
Immigrants from Cambodia vs Immigrants from Norway Single Mother Households Correlation Chart
The statistical analysis conducted on geographies consisting of 205,083,735 people shows a substantial positive correlation between the proportion of Immigrants from Cambodia and percentage of single mother households in the United States with a correlation coefficient (R) of 0.524 and weighted average of 7.2%. Similarly, the statistical analysis conducted on geographies consisting of 116,559,086 people shows a weak positive correlation between the proportion of Immigrants from Norway and percentage of single mother households in the United States with a correlation coefficient (R) of 0.225 and weighted average of 5.6%, a difference of 29.8%.
Single Mother Households Correlation Summary
| Measurement | Immigrants from Cambodia | Immigrants from Norway |
| Minimum | 3.3% | 0.71% |
| Maximum | 20.4% | 13.1% |
| Range | 17.1% | 12.4% |
| Mean | 8.4% | 4.7% |
| Median | 7.4% | 4.2% |
| Interquartile 25% (IQ1) | 6.6% | 2.9% |
| Interquartile 75% (IQ3) | 10.3% | 5.2% |
| Interquartile Range (IQR) | 3.7% | 2.3% |
| Standard Deviation (Sample) | 3.4% | 3.1% |
| Standard Deviation (Population) | 3.4% | 3.0% |
Similar Demographics by Single Mother Households
Demographics Similar to Immigrants from Cambodia by Single Mother Households
In terms of single mother households, the demographic groups most similar to Immigrants from Cambodia are Nicaraguan (7.2%, a difference of 0.18%), Cuban (7.2%, a difference of 0.34%), Ecuadorian (7.2%, a difference of 0.41%), Dutch West Indian (7.3%, a difference of 0.43%), and Fijian (7.2%, a difference of 0.46%).
| Demographics | Rating | Rank | Single Mother Households |
| Panamanians | 0.9 /100 | #238 | Tragic 7.1% |
| Kiowa | 0.8 /100 | #239 | Tragic 7.1% |
| Immigrants | Panama | 0.7 /100 | #240 | Tragic 7.2% |
| Immigrants | Portugal | 0.6 /100 | #241 | Tragic 7.2% |
| Fijians | 0.6 /100 | #242 | Tragic 7.2% |
| Ecuadorians | 0.6 /100 | #243 | Tragic 7.2% |
| Cubans | 0.6 /100 | #244 | Tragic 7.2% |
| Immigrants | Cambodia | 0.5 /100 | #245 | Tragic 7.2% |
| Nicaraguans | 0.5 /100 | #246 | Tragic 7.2% |
| Dutch West Indians | 0.4 /100 | #247 | Tragic 7.3% |
| Spanish American Indians | 0.4 /100 | #248 | Tragic 7.3% |
| Bermudans | 0.4 /100 | #249 | Tragic 7.3% |
| Immigrants | Africa | 0.4 /100 | #250 | Tragic 7.3% |
| Malaysians | 0.3 /100 | #251 | Tragic 7.3% |
| Alaskan Athabascans | 0.3 /100 | #252 | Tragic 7.3% |
Demographics Similar to Immigrants from Norway by Single Mother Households
In terms of single mother households, the demographic groups most similar to Immigrants from Norway are Australian (5.6%, a difference of 0.070%), Polish (5.6%, a difference of 0.080%), Luxembourger (5.6%, a difference of 0.15%), Immigrants from North Macedonia (5.6%, a difference of 0.15%), and Immigrants from France (5.6%, a difference of 0.18%).
| Demographics | Rating | Rank | Single Mother Households |
| Immigrants | Russia | 99.1 /100 | #53 | Exceptional 5.5% |
| Immigrants | Lebanon | 99.1 /100 | #54 | Exceptional 5.5% |
| Immigrants | Denmark | 99.1 /100 | #55 | Exceptional 5.5% |
| Immigrants | Romania | 99.0 /100 | #56 | Exceptional 5.5% |
| Immigrants | Europe | 99.0 /100 | #57 | Exceptional 5.5% |
| Danes | 98.9 /100 | #58 | Exceptional 5.5% |
| Luxembourgers | 98.7 /100 | #59 | Exceptional 5.6% |
| Immigrants | Norway | 98.7 /100 | #60 | Exceptional 5.6% |
| Australians | 98.7 /100 | #61 | Exceptional 5.6% |
| Poles | 98.6 /100 | #62 | Exceptional 5.6% |
| Immigrants | North Macedonia | 98.6 /100 | #63 | Exceptional 5.6% |
| Immigrants | France | 98.6 /100 | #64 | Exceptional 5.6% |
| Greeks | 98.6 /100 | #65 | Exceptional 5.6% |
| Immigrants | Canada | 98.5 /100 | #66 | Exceptional 5.6% |
| Italians | 98.5 /100 | #67 | Exceptional 5.6% |