Bhutanese vs Immigrants from Spain Single Father Households
COMPARE
Bhutanese
Immigrants from Spain
Single Father Households
Single Father Households Comparison
Bhutanese
Immigrants from Spain
2.1%
SINGLE FATHER HOUSEHOLDS
99.5/ 100
METRIC RATING
88th/ 347
METRIC RANK
2.1%
SINGLE FATHER HOUSEHOLDS
99.8/ 100
METRIC RATING
72nd/ 347
METRIC RANK
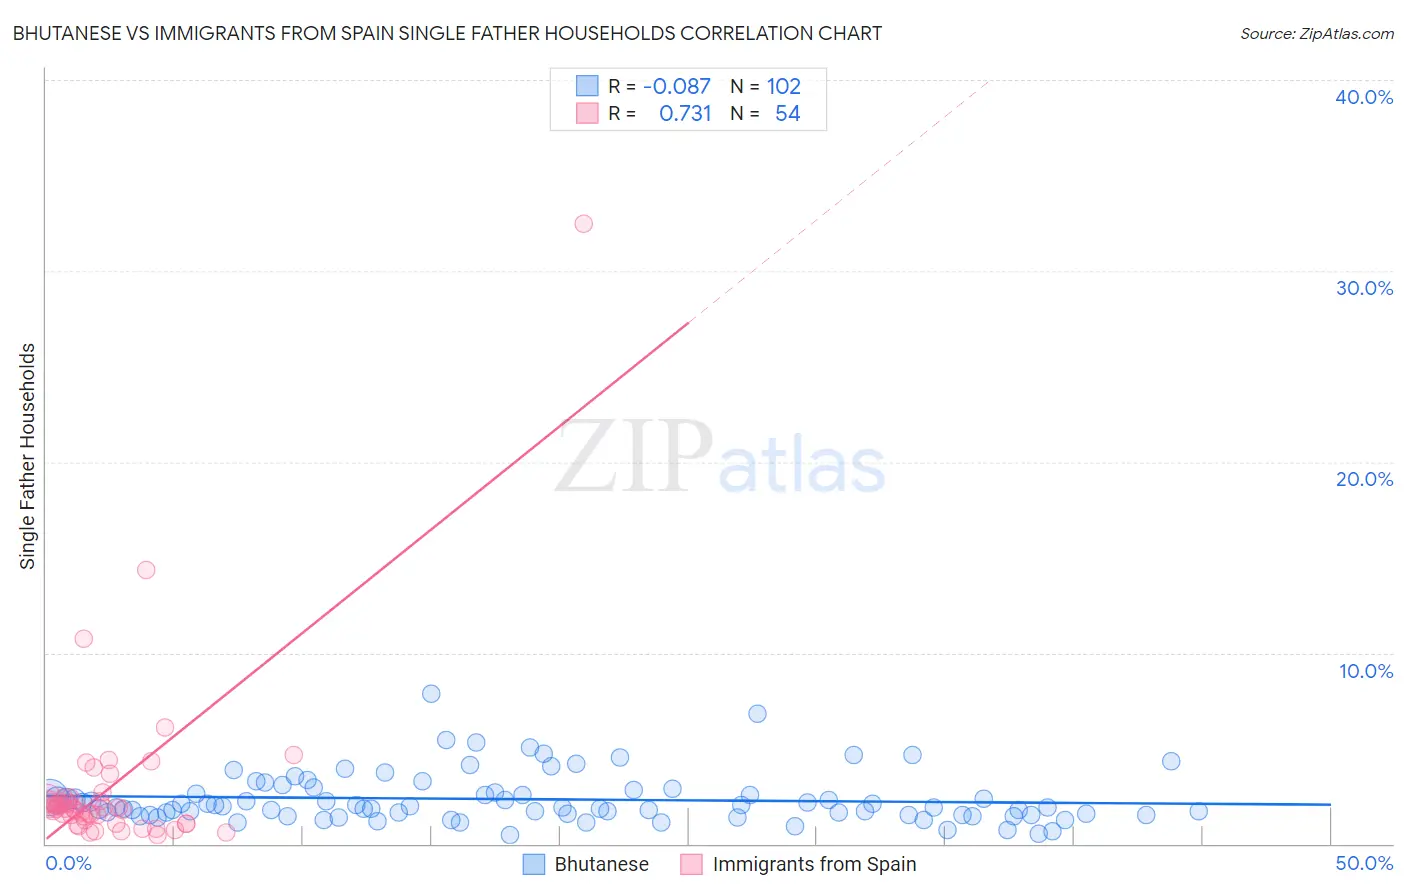
Bhutanese vs Immigrants from Spain Single Father Households Correlation Chart
The statistical analysis conducted on geographies consisting of 450,482,279 people shows a slight negative correlation between the proportion of Bhutanese and percentage of single father households in the United States with a correlation coefficient (R) of -0.087 and weighted average of 2.1%. Similarly, the statistical analysis conducted on geographies consisting of 238,550,854 people shows a strong positive correlation between the proportion of Immigrants from Spain and percentage of single father households in the United States with a correlation coefficient (R) of 0.731 and weighted average of 2.1%, a difference of 2.2%.
Single Father Households Correlation Summary
| Measurement | Bhutanese | Immigrants from Spain |
| Minimum | 0.45% | 0.45% |
| Maximum | 7.8% | 32.5% |
| Range | 7.4% | 32.0% |
| Mean | 2.3% | 2.9% |
| Median | 1.9% | 1.9% |
| Interquartile 25% (IQ1) | 1.5% | 1.3% |
| Interquartile 75% (IQ3) | 2.7% | 2.4% |
| Interquartile Range (IQR) | 1.1% | 1.1% |
| Standard Deviation (Sample) | 1.3% | 4.7% |
| Standard Deviation (Population) | 1.3% | 4.7% |
Demographics Similar to Bhutanese and Immigrants from Spain by Single Father Households
In terms of single father households, the demographic groups most similar to Bhutanese are Immigrants from Armenia (2.1%, a difference of 0.050%), Immigrants from Pakistan (2.1%, a difference of 0.060%), Lithuanian (2.1%, a difference of 0.13%), Asian (2.1%, a difference of 0.64%), and Immigrants from Hungary (2.1%, a difference of 0.72%). Similarly, the demographic groups most similar to Immigrants from Spain are Immigrants from Kuwait (2.1%, a difference of 0.0%), Egyptian (2.1%, a difference of 0.020%), Immigrants from Bangladesh (2.1%, a difference of 0.14%), Immigrants from Egypt (2.1%, a difference of 0.15%), and Immigrants from Sweden (2.1%, a difference of 0.43%).
| Demographics | Rating | Rank | Single Father Households |
| Egyptians | 99.8 /100 | #70 | Exceptional 2.1% |
| Immigrants | Kuwait | 99.8 /100 | #71 | Exceptional 2.1% |
| Immigrants | Spain | 99.8 /100 | #72 | Exceptional 2.1% |
| Immigrants | Bangladesh | 99.8 /100 | #73 | Exceptional 2.1% |
| Immigrants | Egypt | 99.8 /100 | #74 | Exceptional 2.1% |
| Immigrants | Sweden | 99.8 /100 | #75 | Exceptional 2.1% |
| Immigrants | Scotland | 99.8 /100 | #76 | Exceptional 2.1% |
| Immigrants | Saudi Arabia | 99.8 /100 | #77 | Exceptional 2.1% |
| Estonians | 99.7 /100 | #78 | Exceptional 2.1% |
| Immigrants | Asia | 99.7 /100 | #79 | Exceptional 2.1% |
| Immigrants | South Africa | 99.7 /100 | #80 | Exceptional 2.1% |
| Armenians | 99.7 /100 | #81 | Exceptional 2.1% |
| New Zealanders | 99.7 /100 | #82 | Exceptional 2.1% |
| Greeks | 99.7 /100 | #83 | Exceptional 2.1% |
| Carpatho Rusyns | 99.6 /100 | #84 | Exceptional 2.1% |
| Immigrants | Hungary | 99.6 /100 | #85 | Exceptional 2.1% |
| Asians | 99.6 /100 | #86 | Exceptional 2.1% |
| Lithuanians | 99.5 /100 | #87 | Exceptional 2.1% |
| Bhutanese | 99.5 /100 | #88 | Exceptional 2.1% |
| Immigrants | Armenia | 99.5 /100 | #89 | Exceptional 2.1% |
| Immigrants | Pakistan | 99.5 /100 | #90 | Exceptional 2.1% |