Bermudan vs Immigrants from Scotland Unemployment Among Women with Children Under 6 years
COMPARE
Bermudan
Immigrants from Scotland
Unemployment Among Women with Children Under 6 years
Unemployment Among Women with Children Under 6 years Comparison
Bermudans
Immigrants from Scotland
8.7%
UNEMPLOYMENT AMONG WOMEN WITH CHILDREN UNDER 6 YEARS
0.0/ 100
METRIC RATING
282nd/ 347
METRIC RANK
7.6%
UNEMPLOYMENT AMONG WOMEN WITH CHILDREN UNDER 6 YEARS
61.3/ 100
METRIC RATING
169th/ 347
METRIC RANK
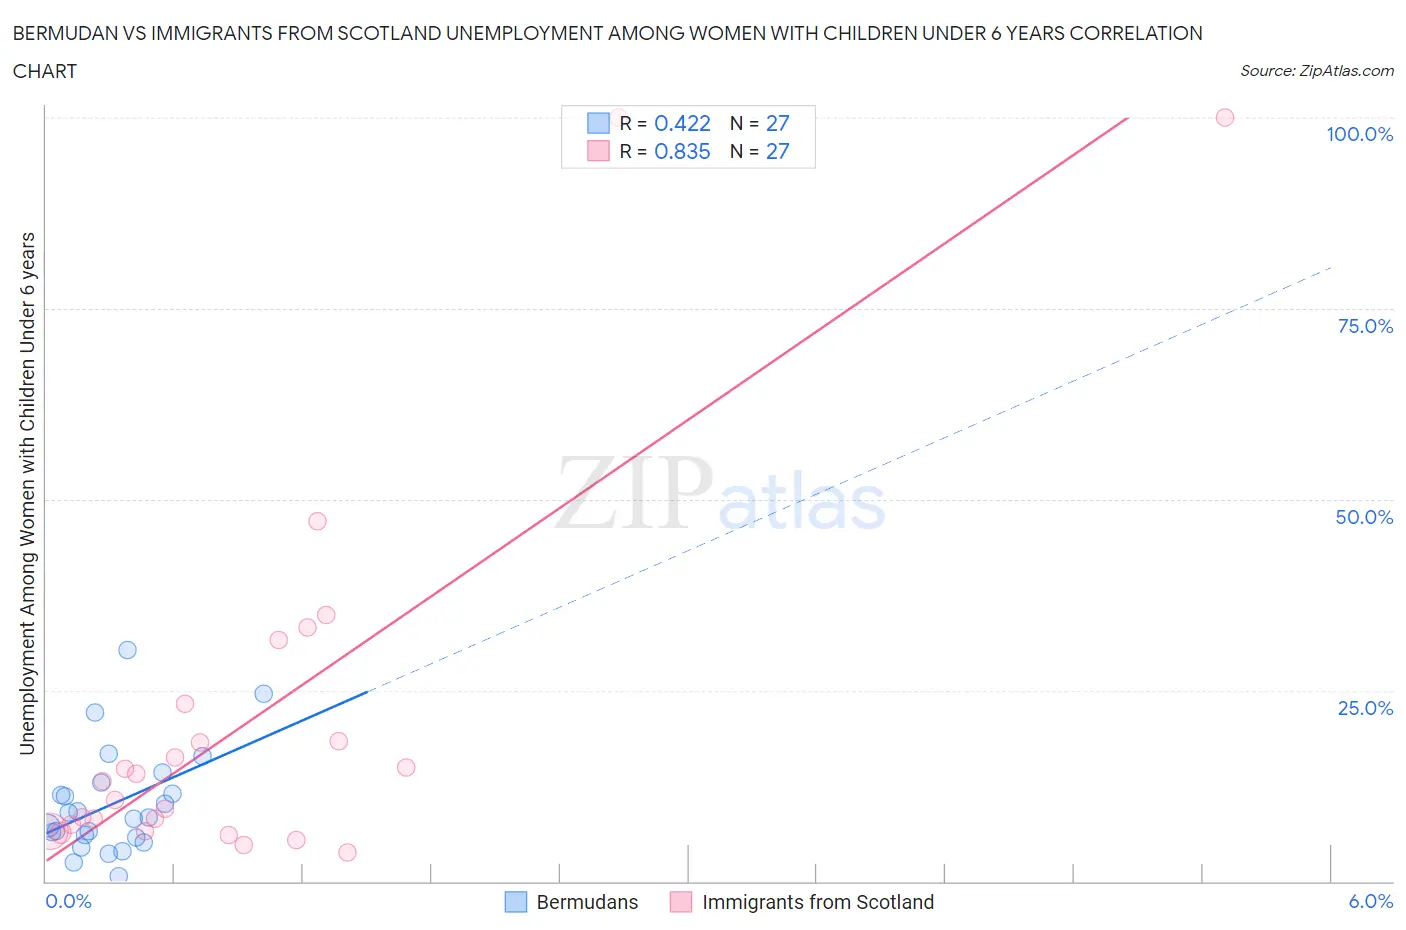
Bermudan vs Immigrants from Scotland Unemployment Among Women with Children Under 6 years Correlation Chart
The statistical analysis conducted on geographies consisting of 52,533,202 people shows a moderate positive correlation between the proportion of Bermudans and unemployment rate among women with children under the age of 6 in the United States with a correlation coefficient (R) of 0.422 and weighted average of 8.7%. Similarly, the statistical analysis conducted on geographies consisting of 161,734,775 people shows a very strong positive correlation between the proportion of Immigrants from Scotland and unemployment rate among women with children under the age of 6 in the United States with a correlation coefficient (R) of 0.835 and weighted average of 7.6%, a difference of 14.2%.
Unemployment Among Women with Children Under 6 years Correlation Summary
| Measurement | Bermudan | Immigrants from Scotland |
| Minimum | 0.60% | 3.7% |
| Maximum | 30.2% | 100.0% |
| Range | 29.6% | 96.3% |
| Mean | 10.2% | 21.2% |
| Median | 8.3% | 13.1% |
| Interquartile 25% (IQ1) | 5.8% | 6.6% |
| Interquartile 75% (IQ3) | 13.0% | 23.2% |
| Interquartile Range (IQR) | 7.2% | 16.6% |
| Standard Deviation (Sample) | 6.9% | 25.1% |
| Standard Deviation (Population) | 6.8% | 24.7% |
Similar Demographics by Unemployment Among Women with Children Under 6 years
Demographics Similar to Bermudans by Unemployment Among Women with Children Under 6 years
In terms of unemployment among women with children under 6 years, the demographic groups most similar to Bermudans are Spanish American Indian (8.7%, a difference of 0.020%), Guatemalan (8.7%, a difference of 0.090%), Blackfeet (8.7%, a difference of 0.18%), Immigrants from Belize (8.6%, a difference of 0.23%), and Immigrants from Dominica (8.6%, a difference of 0.27%).
| Demographics | Rating | Rank | Unemployment Among Women with Children Under 6 years |
| Immigrants | Latin America | 0.1 /100 | #275 | Tragic 8.6% |
| Yaqui | 0.0 /100 | #276 | Tragic 8.6% |
| Haitians | 0.0 /100 | #277 | Tragic 8.6% |
| Immigrants | Dominica | 0.0 /100 | #278 | Tragic 8.6% |
| Immigrants | Guatemala | 0.0 /100 | #279 | Tragic 8.6% |
| Immigrants | Belize | 0.0 /100 | #280 | Tragic 8.6% |
| Guatemalans | 0.0 /100 | #281 | Tragic 8.7% |
| Bermudans | 0.0 /100 | #282 | Tragic 8.7% |
| Spanish American Indians | 0.0 /100 | #283 | Tragic 8.7% |
| Blackfeet | 0.0 /100 | #284 | Tragic 8.7% |
| U.S. Virgin Islanders | 0.0 /100 | #285 | Tragic 8.7% |
| Seminole | 0.0 /100 | #286 | Tragic 8.7% |
| Menominee | 0.0 /100 | #287 | Tragic 8.7% |
| Bahamians | 0.0 /100 | #288 | Tragic 8.7% |
| Iroquois | 0.0 /100 | #289 | Tragic 8.7% |
Demographics Similar to Immigrants from Scotland by Unemployment Among Women with Children Under 6 years
In terms of unemployment among women with children under 6 years, the demographic groups most similar to Immigrants from Scotland are Immigrants from Canada (7.6%, a difference of 0.020%), Kenyan (7.6%, a difference of 0.080%), Czech (7.6%, a difference of 0.11%), Belgian (7.6%, a difference of 0.15%), and Immigrants from Grenada (7.6%, a difference of 0.16%).
| Demographics | Rating | Rank | Unemployment Among Women with Children Under 6 years |
| Immigrants | Lithuania | 68.8 /100 | #162 | Good 7.5% |
| British | 66.3 /100 | #163 | Good 7.6% |
| Ugandans | 65.8 /100 | #164 | Good 7.6% |
| Immigrants | South America | 65.6 /100 | #165 | Good 7.6% |
| Belgians | 63.5 /100 | #166 | Good 7.6% |
| Kenyans | 62.5 /100 | #167 | Good 7.6% |
| Immigrants | Canada | 61.6 /100 | #168 | Good 7.6% |
| Immigrants | Scotland | 61.3 /100 | #169 | Good 7.6% |
| Czechs | 59.8 /100 | #170 | Average 7.6% |
| Immigrants | Grenada | 59.0 /100 | #171 | Average 7.6% |
| Immigrants | North America | 57.7 /100 | #172 | Average 7.6% |
| Cree | 51.6 /100 | #173 | Average 7.6% |
| Immigrants | Laos | 50.0 /100 | #174 | Average 7.6% |
| Panamanians | 49.6 /100 | #175 | Average 7.6% |
| Puget Sound Salish | 47.7 /100 | #176 | Average 7.7% |