Bermudan vs Hopi Currently Married
COMPARE
Bermudan
Hopi
Currently Married
Currently Married Comparison
Bermudans
Hopi
43.5%
CURRENTLY MARRIED
0.1/ 100
METRIC RATING
271st/ 347
METRIC RANK
36.5%
CURRENTLY MARRIED
0.0/ 100
METRIC RATING
346th/ 347
METRIC RANK
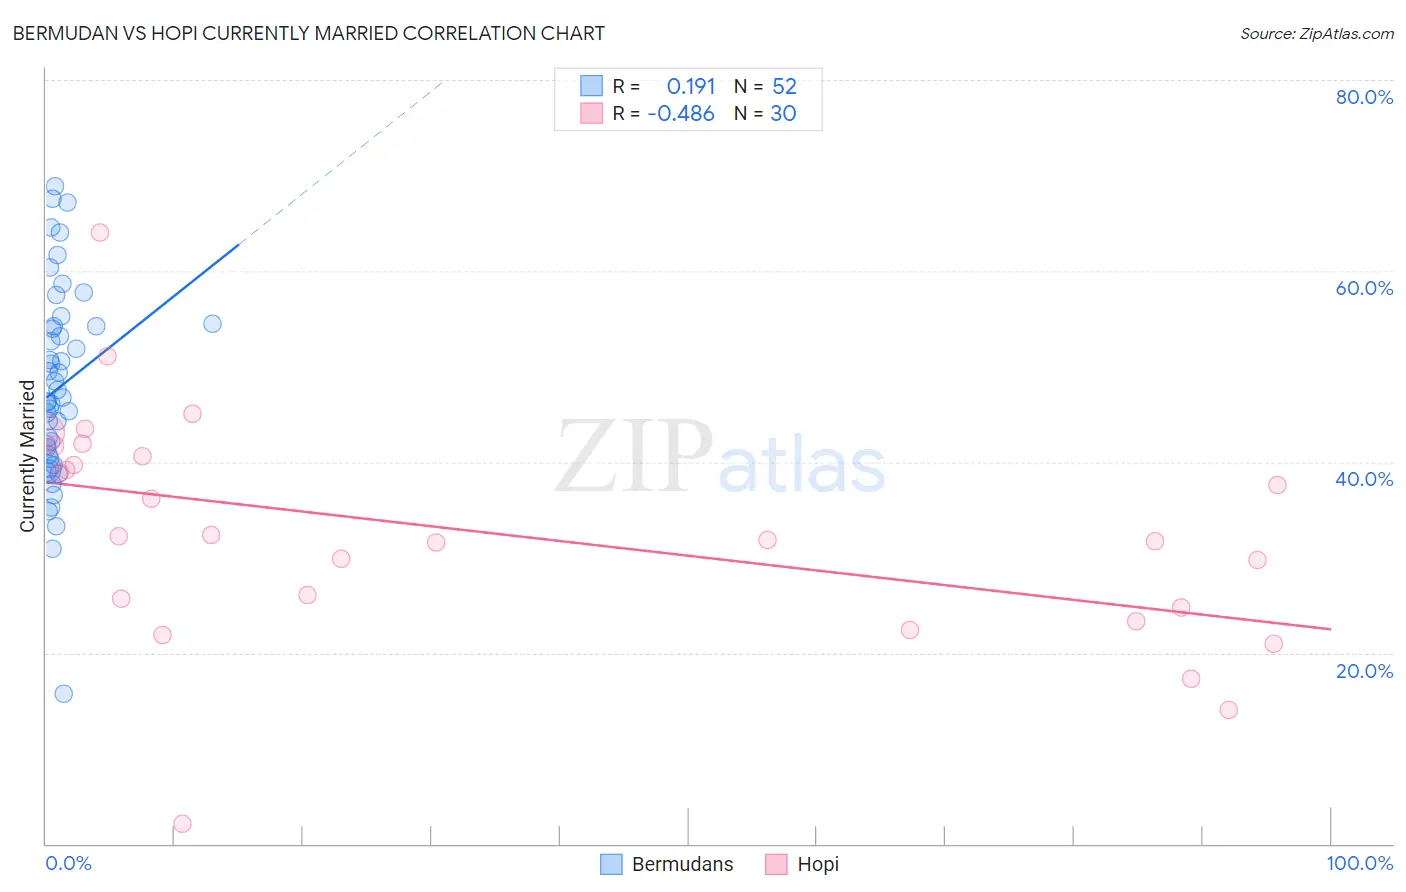
Bermudan vs Hopi Currently Married Correlation Chart
The statistical analysis conducted on geographies consisting of 55,732,325 people shows a poor positive correlation between the proportion of Bermudans and percentage of population currently married in the United States with a correlation coefficient (R) of 0.191 and weighted average of 43.5%. Similarly, the statistical analysis conducted on geographies consisting of 74,739,770 people shows a moderate negative correlation between the proportion of Hopi and percentage of population currently married in the United States with a correlation coefficient (R) of -0.486 and weighted average of 36.5%, a difference of 19.0%.
Currently Married Correlation Summary
| Measurement | Bermudan | Hopi |
| Minimum | 15.7% | 2.1% |
| Maximum | 68.9% | 64.0% |
| Range | 53.2% | 61.9% |
| Mean | 47.7% | 32.7% |
| Median | 46.6% | 32.0% |
| Interquartile 25% (IQ1) | 40.5% | 24.7% |
| Interquartile 75% (IQ3) | 54.2% | 40.6% |
| Interquartile Range (IQR) | 13.7% | 15.9% |
| Standard Deviation (Sample) | 10.4% | 12.1% |
| Standard Deviation (Population) | 10.3% | 11.9% |
Similar Demographics by Currently Married
Demographics Similar to Bermudans by Currently Married
In terms of currently married, the demographic groups most similar to Bermudans are Salvadoran (43.5%, a difference of 0.020%), Indonesian (43.5%, a difference of 0.040%), Yaqui (43.4%, a difference of 0.080%), Immigrants from Sudan (43.5%, a difference of 0.090%), and Nigerian (43.4%, a difference of 0.10%).
| Demographics | Rating | Rank | Currently Married |
| Sudanese | 0.1 /100 | #264 | Tragic 43.7% |
| Immigrants | Bangladesh | 0.1 /100 | #265 | Tragic 43.6% |
| Ecuadorians | 0.1 /100 | #266 | Tragic 43.6% |
| Immigrants | Eritrea | 0.1 /100 | #267 | Tragic 43.6% |
| Spanish American Indians | 0.1 /100 | #268 | Tragic 43.6% |
| Immigrants | Sudan | 0.1 /100 | #269 | Tragic 43.5% |
| Salvadorans | 0.1 /100 | #270 | Tragic 43.5% |
| Bermudans | 0.1 /100 | #271 | Tragic 43.5% |
| Indonesians | 0.1 /100 | #272 | Tragic 43.5% |
| Yaqui | 0.1 /100 | #273 | Tragic 43.4% |
| Nigerians | 0.1 /100 | #274 | Tragic 43.4% |
| Colville | 0.1 /100 | #275 | Tragic 43.4% |
| Sierra Leoneans | 0.1 /100 | #276 | Tragic 43.4% |
| Immigrants | Nigeria | 0.1 /100 | #277 | Tragic 43.4% |
| Central Americans | 0.0 /100 | #278 | Tragic 43.3% |
Demographics Similar to Hopi by Currently Married
In terms of currently married, the demographic groups most similar to Hopi are Tohono O'odham (36.8%, a difference of 0.58%), Pima (35.9%, a difference of 1.8%), Immigrants from Cabo Verde (37.8%, a difference of 3.5%), Pueblo (38.2%, a difference of 4.6%), and Immigrants from Dominican Republic (38.9%, a difference of 6.5%).
| Demographics | Rating | Rank | Currently Married |
| Yup'ik | 0.0 /100 | #333 | Tragic 39.9% |
| Puerto Ricans | 0.0 /100 | #334 | Tragic 39.9% |
| Lumbee | 0.0 /100 | #335 | Tragic 39.8% |
| British West Indians | 0.0 /100 | #336 | Tragic 39.8% |
| Blacks/African Americans | 0.0 /100 | #337 | Tragic 39.6% |
| Cape Verdeans | 0.0 /100 | #338 | Tragic 39.6% |
| Dominicans | 0.0 /100 | #339 | Tragic 39.5% |
| Immigrants | Grenada | 0.0 /100 | #340 | Tragic 39.1% |
| Navajo | 0.0 /100 | #341 | Tragic 39.0% |
| Immigrants | Dominican Republic | 0.0 /100 | #342 | Tragic 38.9% |
| Pueblo | 0.0 /100 | #343 | Tragic 38.2% |
| Immigrants | Cabo Verde | 0.0 /100 | #344 | Tragic 37.8% |
| Tohono O'odham | 0.0 /100 | #345 | Tragic 36.8% |
| Hopi | 0.0 /100 | #346 | Tragic 36.5% |
| Pima | 0.0 /100 | #347 | Tragic 35.9% |