Belizean vs Russian Family Households with Children
COMPARE
Belizean
Russian
Family Households with Children
Family Households with Children Comparison
Belizeans
Russians
27.8%
FAMILY HOUSEHOLDS WITH CHILDREN
90.0/ 100
METRIC RATING
127th/ 347
METRIC RANK
26.5%
FAMILY HOUSEHOLDS WITH CHILDREN
0.2/ 100
METRIC RATING
288th/ 347
METRIC RANK
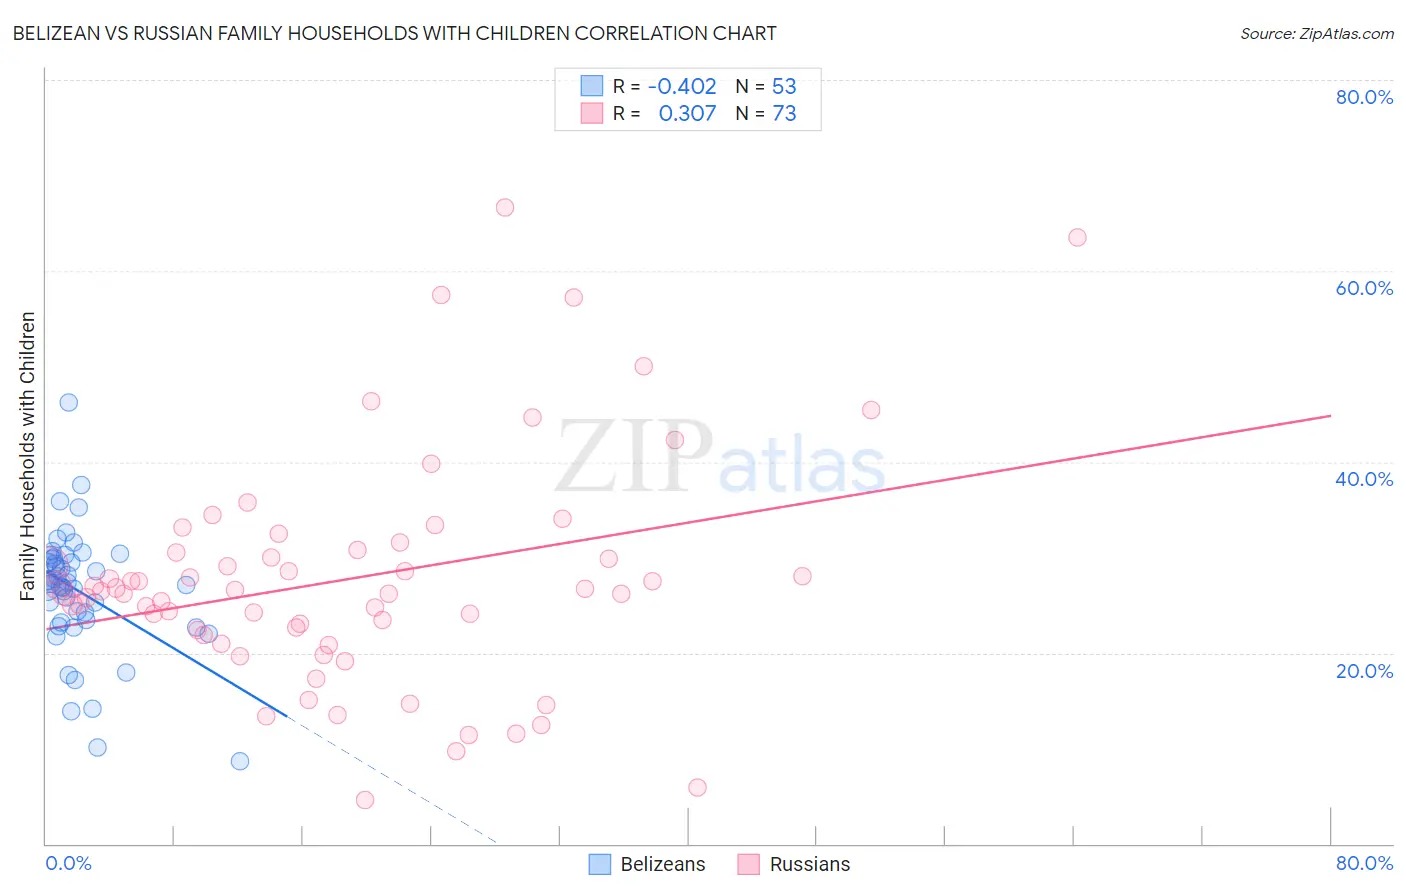
Belizean vs Russian Family Households with Children Correlation Chart
The statistical analysis conducted on geographies consisting of 144,146,110 people shows a moderate negative correlation between the proportion of Belizeans and percentage of family households with children in the United States with a correlation coefficient (R) of -0.402 and weighted average of 27.8%. Similarly, the statistical analysis conducted on geographies consisting of 511,427,529 people shows a mild positive correlation between the proportion of Russians and percentage of family households with children in the United States with a correlation coefficient (R) of 0.307 and weighted average of 26.5%, a difference of 4.8%.
Family Households with Children Correlation Summary
| Measurement | Belizean | Russian |
| Minimum | 8.6% | 4.6% |
| Maximum | 46.2% | 66.7% |
| Range | 37.6% | 62.1% |
| Mean | 26.4% | 27.7% |
| Median | 27.3% | 26.5% |
| Interquartile 25% (IQ1) | 23.3% | 22.2% |
| Interquartile 75% (IQ3) | 29.9% | 30.6% |
| Interquartile Range (IQR) | 6.6% | 8.5% |
| Standard Deviation (Sample) | 6.5% | 12.0% |
| Standard Deviation (Population) | 6.4% | 11.9% |
Similar Demographics by Family Households with Children
Demographics Similar to Belizeans by Family Households with Children
In terms of family households with children, the demographic groups most similar to Belizeans are Syrian (27.8%, a difference of 0.020%), Immigrants from Ethiopia (27.8%, a difference of 0.030%), Immigrants from Eritrea (27.8%, a difference of 0.040%), Immigrants from Singapore (27.8%, a difference of 0.050%), and Ecuadorian (27.8%, a difference of 0.050%).
| Demographics | Rating | Rank | Family Households with Children |
| Europeans | 95.4 /100 | #120 | Exceptional 27.9% |
| Immigrants | Western Asia | 93.6 /100 | #121 | Exceptional 27.9% |
| Immigrants | Zimbabwe | 92.8 /100 | #122 | Exceptional 27.8% |
| Immigrants | Northern Africa | 91.8 /100 | #123 | Exceptional 27.8% |
| Immigrants | Singapore | 90.8 /100 | #124 | Exceptional 27.8% |
| Ecuadorians | 90.8 /100 | #125 | Exceptional 27.8% |
| Immigrants | Ethiopia | 90.5 /100 | #126 | Exceptional 27.8% |
| Belizeans | 90.0 /100 | #127 | Exceptional 27.8% |
| Syrians | 89.7 /100 | #128 | Excellent 27.8% |
| Immigrants | Eritrea | 89.4 /100 | #129 | Excellent 27.8% |
| Cajuns | 87.6 /100 | #130 | Excellent 27.7% |
| Lebanese | 87.4 /100 | #131 | Excellent 27.7% |
| Immigrants | Belize | 85.7 /100 | #132 | Excellent 27.7% |
| Iranians | 85.2 /100 | #133 | Excellent 27.7% |
| Immigrants | Panama | 84.9 /100 | #134 | Excellent 27.7% |
Demographics Similar to Russians by Family Households with Children
In terms of family households with children, the demographic groups most similar to Russians are Immigrants from Senegal (26.5%, a difference of 0.020%), Shoshone (26.5%, a difference of 0.020%), Immigrants from Sweden (26.5%, a difference of 0.050%), Cambodian (26.5%, a difference of 0.070%), and Immigrants from Canada (26.5%, a difference of 0.10%).
| Demographics | Rating | Rank | Family Households with Children |
| Lithuanians | 0.3 /100 | #281 | Tragic 26.6% |
| French American Indians | 0.3 /100 | #282 | Tragic 26.6% |
| Immigrants | North America | 0.3 /100 | #283 | Tragic 26.6% |
| Immigrants | Canada | 0.3 /100 | #284 | Tragic 26.5% |
| Cambodians | 0.2 /100 | #285 | Tragic 26.5% |
| Immigrants | Senegal | 0.2 /100 | #286 | Tragic 26.5% |
| Shoshone | 0.2 /100 | #287 | Tragic 26.5% |
| Russians | 0.2 /100 | #288 | Tragic 26.5% |
| Immigrants | Sweden | 0.2 /100 | #289 | Tragic 26.5% |
| Albanians | 0.2 /100 | #290 | Tragic 26.5% |
| Bahamians | 0.2 /100 | #291 | Tragic 26.5% |
| Poles | 0.2 /100 | #292 | Tragic 26.5% |
| Blacks/African Americans | 0.1 /100 | #293 | Tragic 26.5% |
| Latvians | 0.1 /100 | #294 | Tragic 26.4% |
| Macedonians | 0.1 /100 | #295 | Tragic 26.4% |