Belizean vs Immigrants from Syria Single Mother Households
COMPARE
Belizean
Immigrants from Syria
Single Mother Households
Single Mother Households Comparison
Belizeans
Immigrants from Syria
7.6%
SINGLE MOTHER HOUSEHOLDS
0.1/ 100
METRIC RATING
273rd/ 347
METRIC RANK
6.2%
SINGLE MOTHER HOUSEHOLDS
67.4/ 100
METRIC RATING
165th/ 347
METRIC RANK
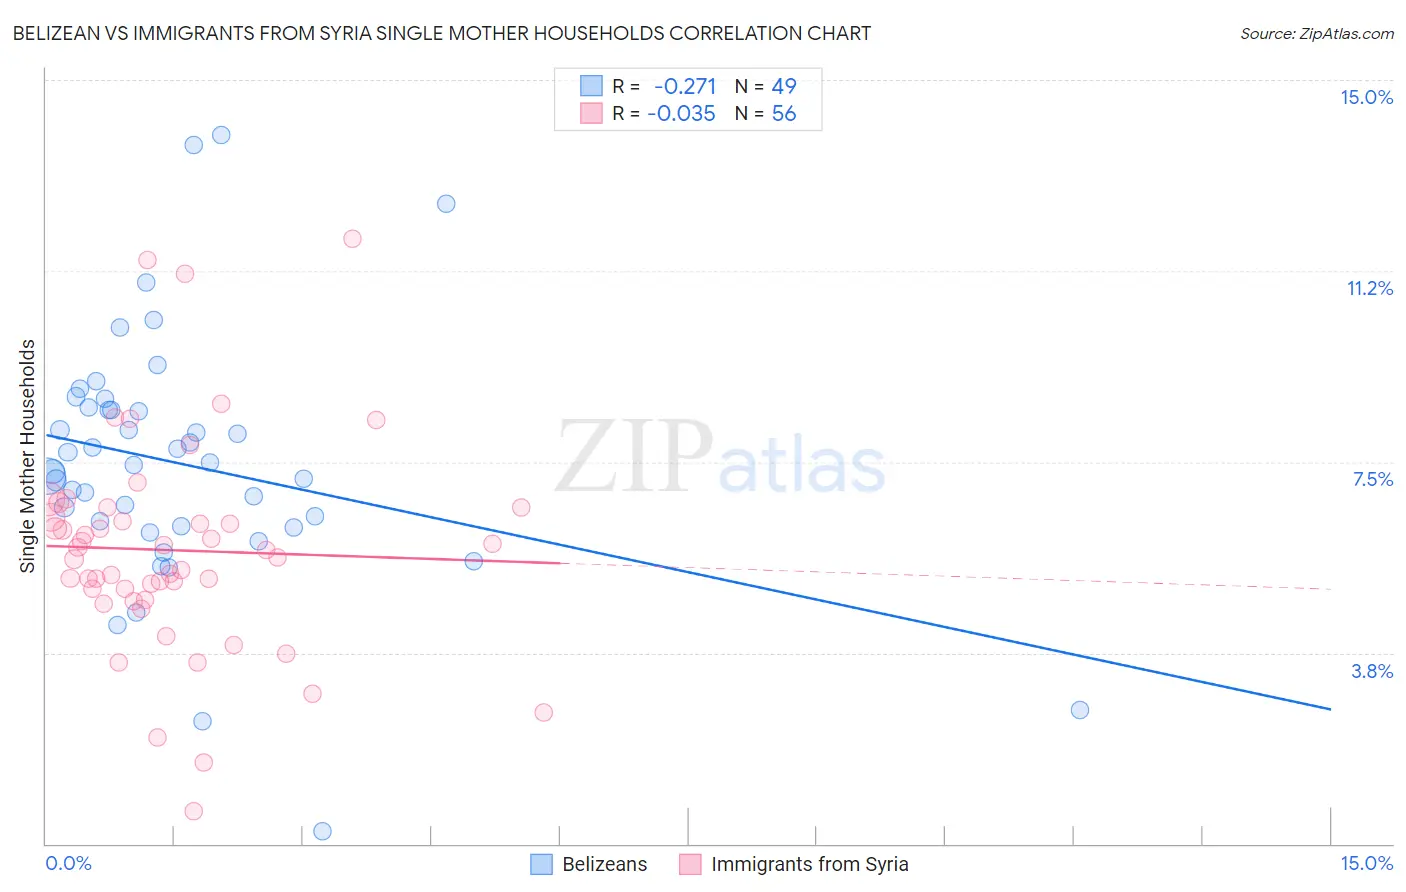
Belizean vs Immigrants from Syria Single Mother Households Correlation Chart
The statistical analysis conducted on geographies consisting of 144,083,349 people shows a weak negative correlation between the proportion of Belizeans and percentage of single mother households in the United States with a correlation coefficient (R) of -0.271 and weighted average of 7.6%. Similarly, the statistical analysis conducted on geographies consisting of 174,032,512 people shows no correlation between the proportion of Immigrants from Syria and percentage of single mother households in the United States with a correlation coefficient (R) of -0.035 and weighted average of 6.2%, a difference of 22.2%.
Single Mother Households Correlation Summary
| Measurement | Belizean | Immigrants from Syria |
| Minimum | 0.26% | 0.64% |
| Maximum | 13.9% | 11.9% |
| Range | 13.7% | 11.2% |
| Mean | 7.5% | 5.8% |
| Median | 7.4% | 5.7% |
| Interquartile 25% (IQ1) | 6.2% | 4.9% |
| Interquartile 75% (IQ3) | 8.5% | 6.5% |
| Interquartile Range (IQR) | 2.3% | 1.6% |
| Standard Deviation (Sample) | 2.5% | 2.1% |
| Standard Deviation (Population) | 2.5% | 2.1% |
Similar Demographics by Single Mother Households
Demographics Similar to Belizeans by Single Mother Households
In terms of single mother households, the demographic groups most similar to Belizeans are Immigrants from Guyana (7.6%, a difference of 0.040%), Central American Indian (7.6%, a difference of 0.14%), Immigrants from the Azores (7.5%, a difference of 0.31%), Salvadoran (7.5%, a difference of 0.32%), and Immigrants from Cuba (7.5%, a difference of 0.40%).
| Demographics | Rating | Rank | Single Mother Households |
| Nepalese | 0.1 /100 | #266 | Tragic 7.5% |
| Blackfeet | 0.1 /100 | #267 | Tragic 7.5% |
| Indonesians | 0.1 /100 | #268 | Tragic 7.5% |
| Somalis | 0.1 /100 | #269 | Tragic 7.5% |
| Immigrants | Cuba | 0.1 /100 | #270 | Tragic 7.5% |
| Salvadorans | 0.1 /100 | #271 | Tragic 7.5% |
| Immigrants | Azores | 0.1 /100 | #272 | Tragic 7.5% |
| Belizeans | 0.1 /100 | #273 | Tragic 7.6% |
| Immigrants | Guyana | 0.1 /100 | #274 | Tragic 7.6% |
| Central American Indians | 0.1 /100 | #275 | Tragic 7.6% |
| Guyanese | 0.1 /100 | #276 | Tragic 7.6% |
| Immigrants | Trinidad and Tobago | 0.1 /100 | #277 | Tragic 7.6% |
| Central Americans | 0.1 /100 | #278 | Tragic 7.6% |
| Immigrants | El Salvador | 0.0 /100 | #279 | Tragic 7.6% |
| Immigrants | Sierra Leone | 0.0 /100 | #280 | Tragic 7.7% |
Demographics Similar to Immigrants from Syria by Single Mother Households
In terms of single mother households, the demographic groups most similar to Immigrants from Syria are Immigrants from Northern Africa (6.2%, a difference of 0.070%), Alsatian (6.2%, a difference of 0.16%), Immigrants from Zimbabwe (6.2%, a difference of 0.32%), Sri Lankan (6.2%, a difference of 0.43%), and Immigrants from Germany (6.1%, a difference of 0.67%).
| Demographics | Rating | Rank | Single Mother Households |
| Celtics | 73.3 /100 | #158 | Good 6.1% |
| Yugoslavians | 73.1 /100 | #159 | Good 6.1% |
| Iraqis | 73.0 /100 | #160 | Good 6.1% |
| Immigrants | Germany | 72.4 /100 | #161 | Good 6.1% |
| Immigrants | Zimbabwe | 69.9 /100 | #162 | Good 6.2% |
| Alsatians | 68.7 /100 | #163 | Good 6.2% |
| Immigrants | Northern Africa | 68.0 /100 | #164 | Good 6.2% |
| Immigrants | Syria | 67.4 /100 | #165 | Good 6.2% |
| Sri Lankans | 63.9 /100 | #166 | Good 6.2% |
| Brazilians | 59.1 /100 | #167 | Average 6.2% |
| Immigrants | Chile | 58.3 /100 | #168 | Average 6.3% |
| Puget Sound Salish | 58.1 /100 | #169 | Average 6.3% |
| Immigrants | Oceania | 54.6 /100 | #170 | Average 6.3% |
| Afghans | 52.5 /100 | #171 | Average 6.3% |
| Immigrants | South Eastern Asia | 52.2 /100 | #172 | Average 6.3% |