Bahamian vs Malaysian Divorced or Separated
COMPARE
Bahamian
Malaysian
Divorced or Separated
Divorced or Separated Comparison
Bahamians
Malaysians
14.2%
DIVORCED OR SEPARATED
0.0/ 100
METRIC RATING
341st/ 347
METRIC RANK
12.4%
DIVORCED OR SEPARATED
4.8/ 100
METRIC RATING
233rd/ 347
METRIC RANK
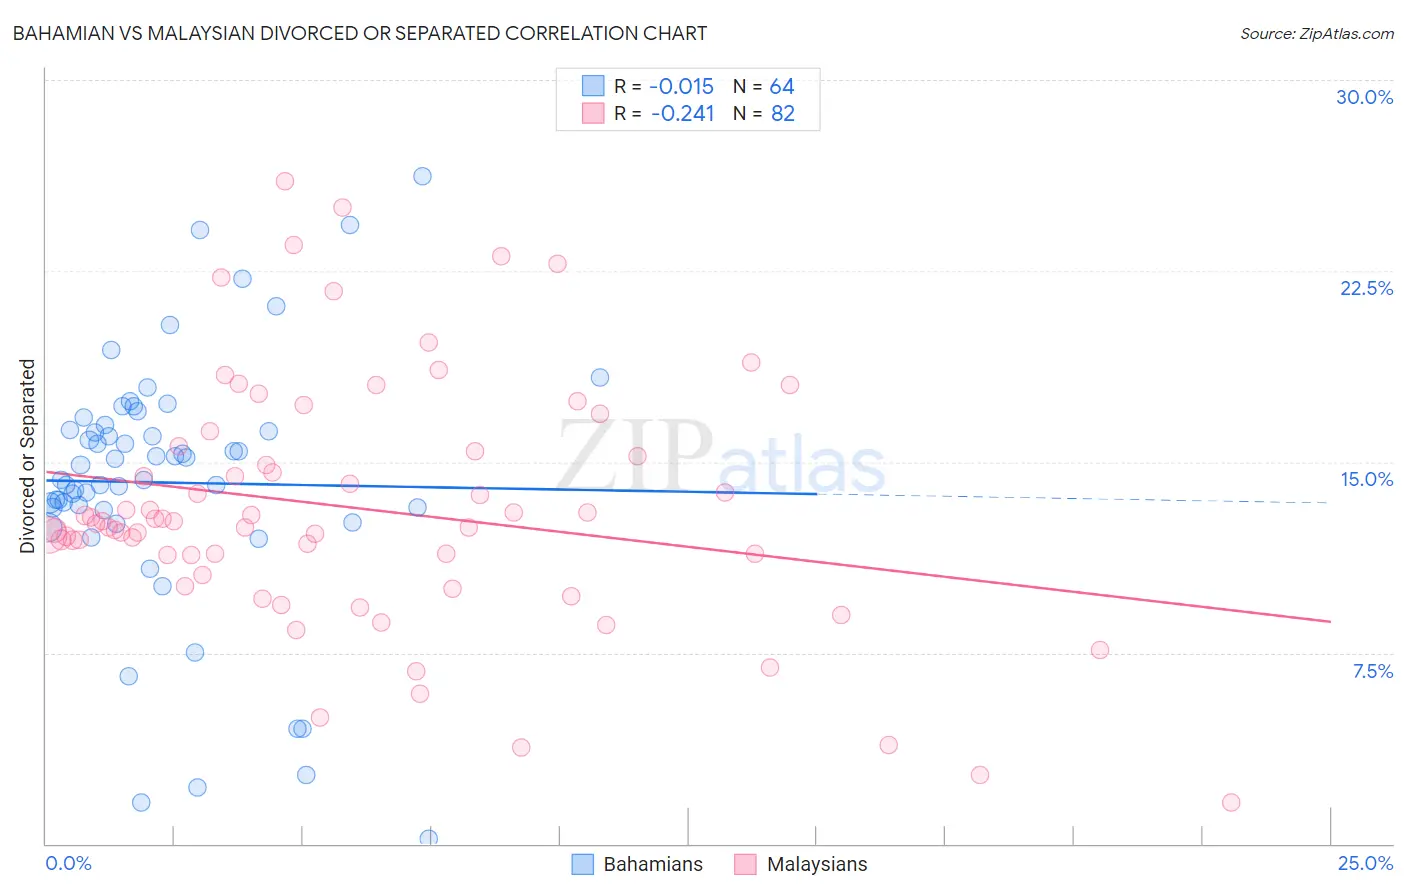
Bahamian vs Malaysian Divorced or Separated Correlation Chart
The statistical analysis conducted on geographies consisting of 112,659,995 people shows no correlation between the proportion of Bahamians and percentage of population currently divorced or separated in the United States with a correlation coefficient (R) of -0.015 and weighted average of 14.2%. Similarly, the statistical analysis conducted on geographies consisting of 226,068,380 people shows a weak negative correlation between the proportion of Malaysians and percentage of population currently divorced or separated in the United States with a correlation coefficient (R) of -0.241 and weighted average of 12.4%, a difference of 15.1%.
Divorced or Separated Correlation Summary
| Measurement | Bahamian | Malaysian |
| Minimum | 0.20% | 1.6% |
| Maximum | 26.2% | 26.0% |
| Range | 26.0% | 24.4% |
| Mean | 14.2% | 13.2% |
| Median | 14.6% | 12.6% |
| Interquartile 25% (IQ1) | 13.1% | 11.4% |
| Interquartile 75% (IQ3) | 16.4% | 15.4% |
| Interquartile Range (IQR) | 3.2% | 4.0% |
| Standard Deviation (Sample) | 5.1% | 4.9% |
| Standard Deviation (Population) | 5.0% | 4.8% |
Similar Demographics by Divorced or Separated
Demographics Similar to Bahamians by Divorced or Separated
In terms of divorced or separated, the demographic groups most similar to Bahamians are Seminole (14.3%, a difference of 0.17%), Chickasaw (14.2%, a difference of 0.20%), Colville (14.2%, a difference of 0.24%), Choctaw (14.1%, a difference of 0.77%), and Crow (14.1%, a difference of 1.1%).
| Demographics | Rating | Rank | Divorced or Separated |
| Puerto Ricans | 0.0 /100 | #333 | Tragic 13.9% |
| Immigrants | Bahamas | 0.0 /100 | #334 | Tragic 13.9% |
| Dutch West Indians | 0.0 /100 | #335 | Tragic 14.0% |
| Shoshone | 0.0 /100 | #336 | Tragic 14.0% |
| Crow | 0.0 /100 | #337 | Tragic 14.1% |
| Choctaw | 0.0 /100 | #338 | Tragic 14.1% |
| Colville | 0.0 /100 | #339 | Tragic 14.2% |
| Chickasaw | 0.0 /100 | #340 | Tragic 14.2% |
| Bahamians | 0.0 /100 | #341 | Tragic 14.2% |
| Seminole | 0.0 /100 | #342 | Tragic 14.3% |
| Creek | 0.0 /100 | #343 | Tragic 14.4% |
| Cubans | 0.0 /100 | #344 | Tragic 14.5% |
| Kiowa | 0.0 /100 | #345 | Tragic 14.5% |
| Arapaho | 0.0 /100 | #346 | Tragic 14.8% |
| Immigrants | Cuba | 0.0 /100 | #347 | Tragic 15.2% |
Demographics Similar to Malaysians by Divorced or Separated
In terms of divorced or separated, the demographic groups most similar to Malaysians are West Indian (12.4%, a difference of 0.080%), Canadian (12.4%, a difference of 0.090%), Immigrants from Bosnia and Herzegovina (12.4%, a difference of 0.10%), Colombian (12.4%, a difference of 0.13%), and Immigrants from Laos (12.4%, a difference of 0.13%).
| Demographics | Rating | Rank | Divorced or Separated |
| Immigrants | Western Africa | 9.3 /100 | #226 | Tragic 12.3% |
| Hmong | 8.8 /100 | #227 | Tragic 12.3% |
| Immigrants | Cameroon | 8.3 /100 | #228 | Tragic 12.3% |
| Immigrants | Sudan | 8.2 /100 | #229 | Tragic 12.3% |
| Yakama | 7.8 /100 | #230 | Tragic 12.3% |
| Yugoslavians | 6.6 /100 | #231 | Tragic 12.3% |
| Canadians | 5.3 /100 | #232 | Tragic 12.4% |
| Malaysians | 4.8 /100 | #233 | Tragic 12.4% |
| West Indians | 4.4 /100 | #234 | Tragic 12.4% |
| Immigrants | Bosnia and Herzegovina | 4.3 /100 | #235 | Tragic 12.4% |
| Colombians | 4.2 /100 | #236 | Tragic 12.4% |
| Immigrants | Laos | 4.2 /100 | #237 | Tragic 12.4% |
| Sudanese | 4.0 /100 | #238 | Tragic 12.4% |
| Immigrants | Germany | 4.0 /100 | #239 | Tragic 12.4% |
| British West Indians | 3.7 /100 | #240 | Tragic 12.4% |