Armenian vs Colombian Average Family Size
COMPARE
Armenian
Colombian
Average Family Size
Average Family Size Comparison
Armenians
Colombians
3.25
AVERAGE FAMILY SIZE
78.2/ 100
METRIC RATING
145th/ 347
METRIC RANK
3.26
AVERAGE FAMILY SIZE
89.9/ 100
METRIC RATING
128th/ 347
METRIC RANK
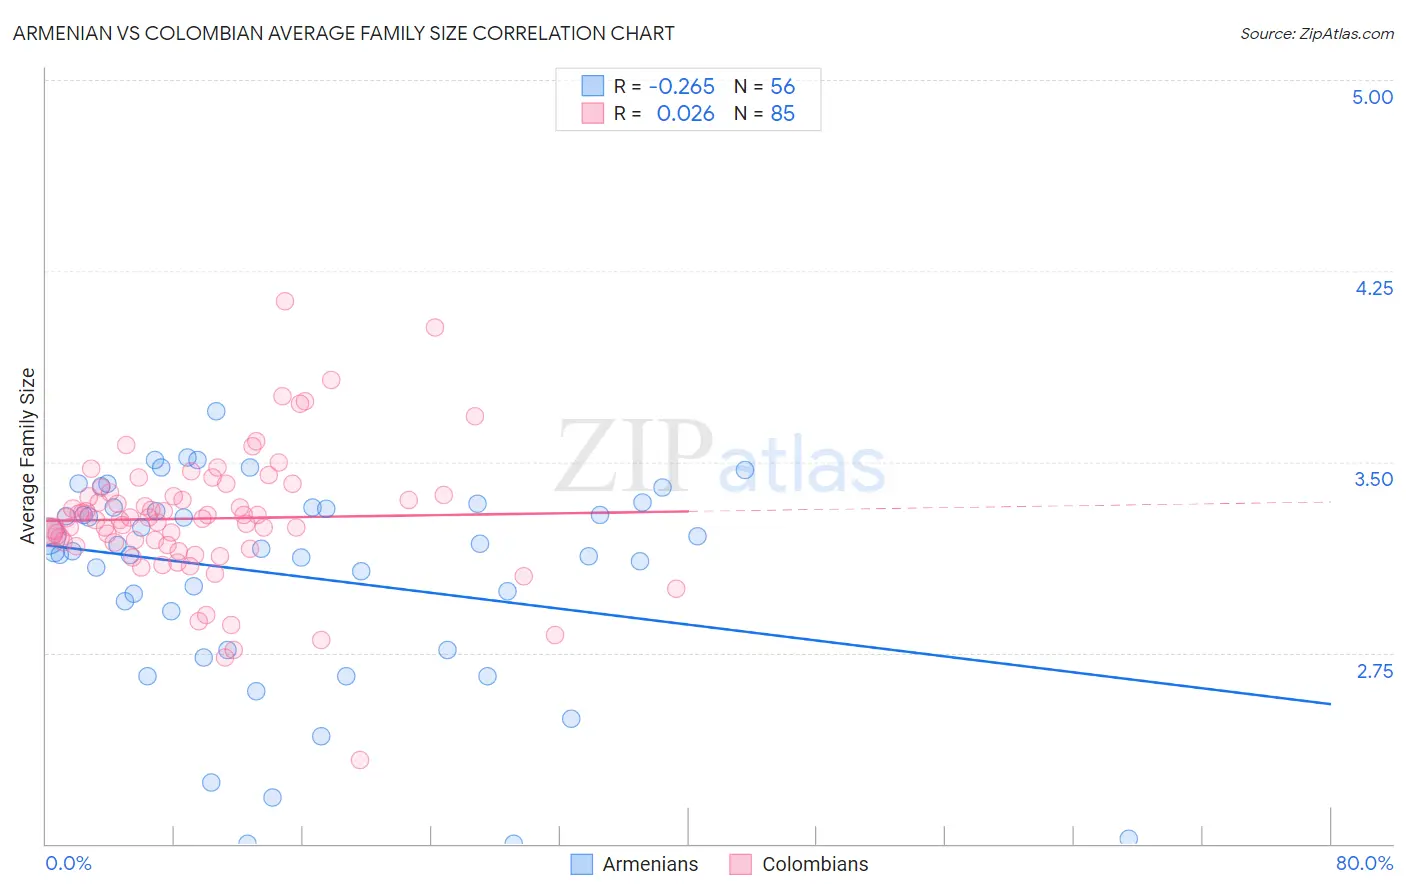
Armenian vs Colombian Average Family Size Correlation Chart
The statistical analysis conducted on geographies consisting of 310,784,313 people shows a weak negative correlation between the proportion of Armenians and average family size in the United States with a correlation coefficient (R) of -0.265 and weighted average of 3.25. Similarly, the statistical analysis conducted on geographies consisting of 419,324,295 people shows no correlation between the proportion of Colombians and average family size in the United States with a correlation coefficient (R) of 0.026 and weighted average of 3.26, a difference of 0.41%.
Average Family Size Correlation Summary
| Measurement | Armenian | Colombian |
| Minimum | 2.00 | 2.33 |
| Maximum | 3.70 | 4.13 |
| Range | 1.70 | 1.80 |
| Mean | 3.05 | 3.28 |
| Median | 3.16 | 3.28 |
| Interquartile 25% (IQ1) | 2.84 | 3.17 |
| Interquartile 75% (IQ3) | 3.32 | 3.37 |
| Interquartile Range (IQR) | 0.48 | 0.20 |
| Standard Deviation (Sample) | 0.41 | 0.26 |
| Standard Deviation (Population) | 0.41 | 0.26 |
Demographics Similar to Armenians and Colombians by Average Family Size
In terms of average family size, the demographic groups most similar to Armenians are Immigrants from Africa (3.25, a difference of 0.010%), Tsimshian (3.25, a difference of 0.050%), Bhutanese (3.25, a difference of 0.080%), Venezuelan (3.25, a difference of 0.090%), and Liberian (3.25, a difference of 0.090%). Similarly, the demographic groups most similar to Colombians are Immigrants from Costa Rica (3.26, a difference of 0.040%), Immigrants from Syria (3.26, a difference of 0.040%), Immigrants from Hong Kong (3.26, a difference of 0.060%), Laotian (3.26, a difference of 0.060%), and Immigrants from Western Asia (3.26, a difference of 0.10%).
| Demographics | Rating | Rank | Average Family Size |
| Immigrants | Costa Rica | 90.7 /100 | #126 | Exceptional 3.26 |
| Immigrants | Syria | 90.6 /100 | #127 | Exceptional 3.26 |
| Colombians | 89.9 /100 | #128 | Excellent 3.26 |
| Immigrants | Hong Kong | 88.6 /100 | #129 | Excellent 3.26 |
| Laotians | 88.5 /100 | #130 | Excellent 3.26 |
| Immigrants | Western Asia | 87.7 /100 | #131 | Excellent 3.26 |
| Costa Ricans | 86.8 /100 | #132 | Excellent 3.26 |
| Immigrants | Venezuela | 86.3 /100 | #133 | Excellent 3.26 |
| Africans | 84.9 /100 | #134 | Excellent 3.25 |
| Panamanians | 84.2 /100 | #135 | Excellent 3.25 |
| Comanche | 82.8 /100 | #136 | Excellent 3.25 |
| Immigrants | Middle Africa | 82.4 /100 | #137 | Excellent 3.25 |
| Cubans | 81.8 /100 | #138 | Excellent 3.25 |
| Immigrants | Ethiopia | 81.6 /100 | #139 | Excellent 3.25 |
| Sub-Saharan Africans | 81.6 /100 | #140 | Excellent 3.25 |
| Venezuelans | 81.4 /100 | #141 | Excellent 3.25 |
| Liberians | 81.2 /100 | #142 | Excellent 3.25 |
| Bhutanese | 81.0 /100 | #143 | Excellent 3.25 |
| Tsimshian | 80.2 /100 | #144 | Excellent 3.25 |
| Armenians | 78.2 /100 | #145 | Good 3.25 |
| Immigrants | Africa | 77.9 /100 | #146 | Good 3.25 |