Arapaho vs Spanish American Single Father Households
COMPARE
Arapaho
Spanish American
Single Father Households
Single Father Households Comparison
Arapaho
Spanish Americans
2.9%
SINGLE FATHER HOUSEHOLDS
0.0/ 100
METRIC RATING
313th/ 347
METRIC RANK
2.8%
SINGLE FATHER HOUSEHOLDS
0.0/ 100
METRIC RATING
302nd/ 347
METRIC RANK
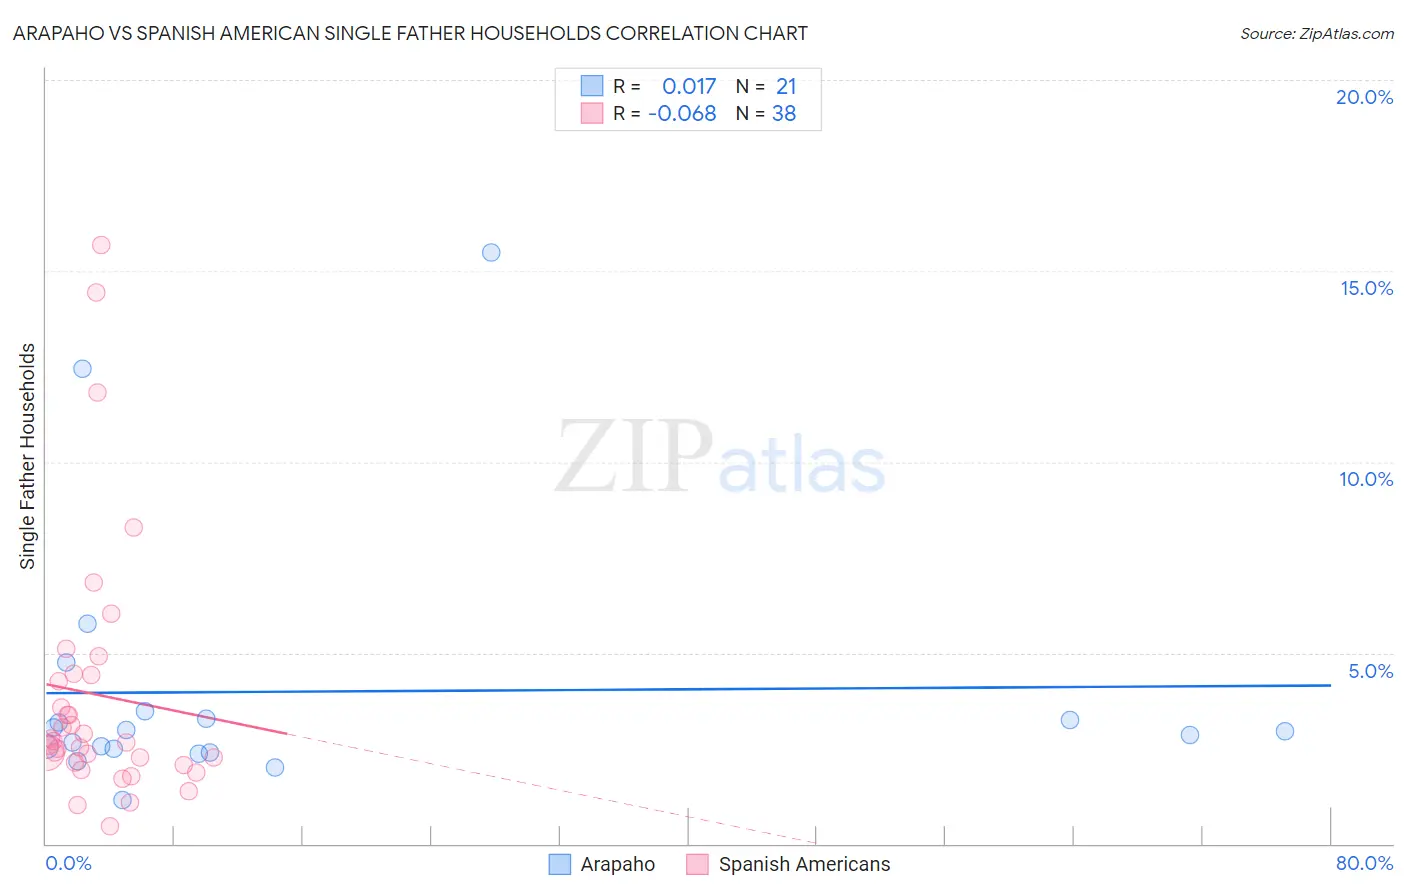
Arapaho vs Spanish American Single Father Households Correlation Chart
The statistical analysis conducted on geographies consisting of 29,720,466 people shows no correlation between the proportion of Arapaho and percentage of single father households in the United States with a correlation coefficient (R) of 0.017 and weighted average of 2.9%. Similarly, the statistical analysis conducted on geographies consisting of 102,947,079 people shows a slight negative correlation between the proportion of Spanish Americans and percentage of single father households in the United States with a correlation coefficient (R) of -0.068 and weighted average of 2.8%, a difference of 3.4%.
Single Father Households Correlation Summary
| Measurement | Arapaho | Spanish American |
| Minimum | 1.1% | 0.47% |
| Maximum | 15.5% | 15.7% |
| Range | 14.4% | 15.2% |
| Mean | 4.0% | 3.9% |
| Median | 3.0% | 2.7% |
| Interquartile 25% (IQ1) | 2.4% | 2.1% |
| Interquartile 75% (IQ3) | 3.4% | 4.4% |
| Interquartile Range (IQR) | 0.93% | 2.3% |
| Standard Deviation (Sample) | 3.5% | 3.4% |
| Standard Deviation (Population) | 3.4% | 3.4% |
Demographics Similar to Arapaho and Spanish Americans by Single Father Households
In terms of single father households, the demographic groups most similar to Arapaho are Salvadoran (2.9%, a difference of 0.25%), Tsimshian (2.9%, a difference of 0.42%), Cheyenne (2.9%, a difference of 0.64%), Houma (2.9%, a difference of 0.64%), and Spanish American Indian (2.9%, a difference of 0.99%). Similarly, the demographic groups most similar to Spanish Americans are Immigrants from Honduras (2.8%, a difference of 0.020%), Mexican American Indian (2.8%, a difference of 0.33%), Hispanic or Latino (2.8%, a difference of 0.49%), Immigrants from Latin America (2.8%, a difference of 0.53%), and Kiowa (2.8%, a difference of 0.58%).
| Demographics | Rating | Rank | Single Father Households |
| Hondurans | 0.0 /100 | #297 | Tragic 2.8% |
| Cree | 0.0 /100 | #298 | Tragic 2.8% |
| Lumbee | 0.0 /100 | #299 | Tragic 2.8% |
| Kiowa | 0.0 /100 | #300 | Tragic 2.8% |
| Immigrants | Latin America | 0.0 /100 | #301 | Tragic 2.8% |
| Spanish Americans | 0.0 /100 | #302 | Tragic 2.8% |
| Immigrants | Honduras | 0.0 /100 | #303 | Tragic 2.8% |
| Mexican American Indians | 0.0 /100 | #304 | Tragic 2.8% |
| Hispanics or Latinos | 0.0 /100 | #305 | Tragic 2.8% |
| Immigrants | Azores | 0.0 /100 | #306 | Tragic 2.8% |
| Hopi | 0.0 /100 | #307 | Tragic 2.8% |
| Apache | 0.0 /100 | #308 | Tragic 2.8% |
| Central Americans | 0.0 /100 | #309 | Tragic 2.9% |
| Immigrants | Laos | 0.0 /100 | #310 | Tragic 2.9% |
| Spanish American Indians | 0.0 /100 | #311 | Tragic 2.9% |
| Tsimshian | 0.0 /100 | #312 | Tragic 2.9% |
| Arapaho | 0.0 /100 | #313 | Tragic 2.9% |
| Salvadorans | 0.0 /100 | #314 | Tragic 2.9% |
| Cheyenne | 0.0 /100 | #315 | Tragic 2.9% |
| Houma | 0.0 /100 | #316 | Tragic 2.9% |
| Immigrants | El Salvador | 0.0 /100 | #317 | Tragic 2.9% |