Arab vs Russian Family Households with Children
COMPARE
Arab
Russian
Family Households with Children
Family Households with Children Comparison
Arabs
Russians
28.0%
FAMILY HOUSEHOLDS WITH CHILDREN
97.0/ 100
METRIC RATING
113th/ 347
METRIC RANK
26.5%
FAMILY HOUSEHOLDS WITH CHILDREN
0.2/ 100
METRIC RATING
288th/ 347
METRIC RANK
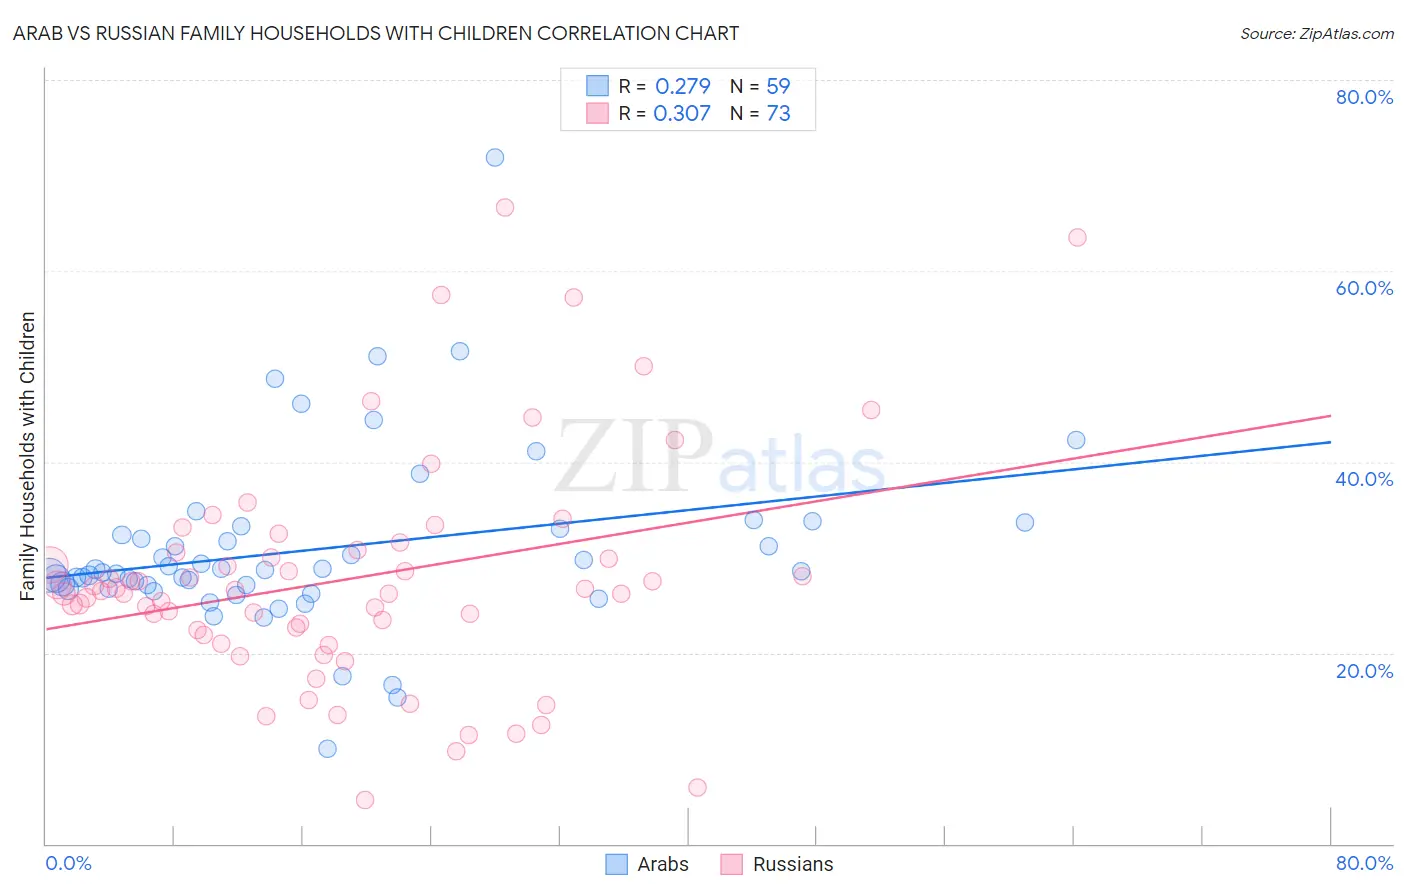
Arab vs Russian Family Households with Children Correlation Chart
The statistical analysis conducted on geographies consisting of 486,135,019 people shows a weak positive correlation between the proportion of Arabs and percentage of family households with children in the United States with a correlation coefficient (R) of 0.279 and weighted average of 28.0%. Similarly, the statistical analysis conducted on geographies consisting of 511,427,529 people shows a mild positive correlation between the proportion of Russians and percentage of family households with children in the United States with a correlation coefficient (R) of 0.307 and weighted average of 26.5%, a difference of 5.5%.
Family Households with Children Correlation Summary
| Measurement | Arab | Russian |
| Minimum | 10.0% | 4.6% |
| Maximum | 71.9% | 66.7% |
| Range | 61.9% | 62.1% |
| Mean | 30.8% | 27.7% |
| Median | 28.6% | 26.5% |
| Interquartile 25% (IQ1) | 26.7% | 22.2% |
| Interquartile 75% (IQ3) | 33.0% | 30.6% |
| Interquartile Range (IQR) | 6.2% | 8.5% |
| Standard Deviation (Sample) | 9.4% | 12.0% |
| Standard Deviation (Population) | 9.4% | 11.9% |
Similar Demographics by Family Households with Children
Demographics Similar to Arabs by Family Households with Children
In terms of family households with children, the demographic groups most similar to Arabs are Immigrants from Middle Africa (28.0%, a difference of 0.010%), South American Indian (28.0%, a difference of 0.020%), Scandinavian (28.0%, a difference of 0.030%), Immigrants from Africa (28.0%, a difference of 0.030%), and Spaniard (28.0%, a difference of 0.10%).
| Demographics | Rating | Rank | Family Households with Children |
| Immigrants | South America | 98.0 /100 | #106 | Exceptional 28.0% |
| Immigrants | Uganda | 97.7 /100 | #107 | Exceptional 28.0% |
| Immigrants | Burma/Myanmar | 97.7 /100 | #108 | Exceptional 28.0% |
| Tohono O'odham | 97.6 /100 | #109 | Exceptional 28.0% |
| Spaniards | 97.4 /100 | #110 | Exceptional 28.0% |
| Scandinavians | 97.1 /100 | #111 | Exceptional 28.0% |
| Immigrants | Middle Africa | 97.0 /100 | #112 | Exceptional 28.0% |
| Arabs | 97.0 /100 | #113 | Exceptional 28.0% |
| South American Indians | 96.9 /100 | #114 | Exceptional 28.0% |
| Immigrants | Africa | 96.8 /100 | #115 | Exceptional 28.0% |
| Pakistanis | 96.0 /100 | #116 | Exceptional 27.9% |
| Immigrants | Malaysia | 95.9 /100 | #117 | Exceptional 27.9% |
| Central American Indians | 95.9 /100 | #118 | Exceptional 27.9% |
| Zimbabweans | 95.6 /100 | #119 | Exceptional 27.9% |
| Europeans | 95.4 /100 | #120 | Exceptional 27.9% |
Demographics Similar to Russians by Family Households with Children
In terms of family households with children, the demographic groups most similar to Russians are Immigrants from Senegal (26.5%, a difference of 0.020%), Shoshone (26.5%, a difference of 0.020%), Immigrants from Sweden (26.5%, a difference of 0.050%), Cambodian (26.5%, a difference of 0.070%), and Immigrants from Canada (26.5%, a difference of 0.10%).
| Demographics | Rating | Rank | Family Households with Children |
| Lithuanians | 0.3 /100 | #281 | Tragic 26.6% |
| French American Indians | 0.3 /100 | #282 | Tragic 26.6% |
| Immigrants | North America | 0.3 /100 | #283 | Tragic 26.6% |
| Immigrants | Canada | 0.3 /100 | #284 | Tragic 26.5% |
| Cambodians | 0.2 /100 | #285 | Tragic 26.5% |
| Immigrants | Senegal | 0.2 /100 | #286 | Tragic 26.5% |
| Shoshone | 0.2 /100 | #287 | Tragic 26.5% |
| Russians | 0.2 /100 | #288 | Tragic 26.5% |
| Immigrants | Sweden | 0.2 /100 | #289 | Tragic 26.5% |
| Albanians | 0.2 /100 | #290 | Tragic 26.5% |
| Bahamians | 0.2 /100 | #291 | Tragic 26.5% |
| Poles | 0.2 /100 | #292 | Tragic 26.5% |
| Blacks/African Americans | 0.1 /100 | #293 | Tragic 26.5% |
| Latvians | 0.1 /100 | #294 | Tragic 26.4% |
| Macedonians | 0.1 /100 | #295 | Tragic 26.4% |