Apache vs Immigrants from Northern Africa Single Mother Households
COMPARE
Apache
Immigrants from Northern Africa
Single Mother Households
Single Mother Households Comparison
Apache
Immigrants from Northern Africa
7.9%
SINGLE MOTHER HOUSEHOLDS
0.0/ 100
METRIC RATING
294th/ 347
METRIC RANK
6.2%
SINGLE MOTHER HOUSEHOLDS
68.0/ 100
METRIC RATING
164th/ 347
METRIC RANK
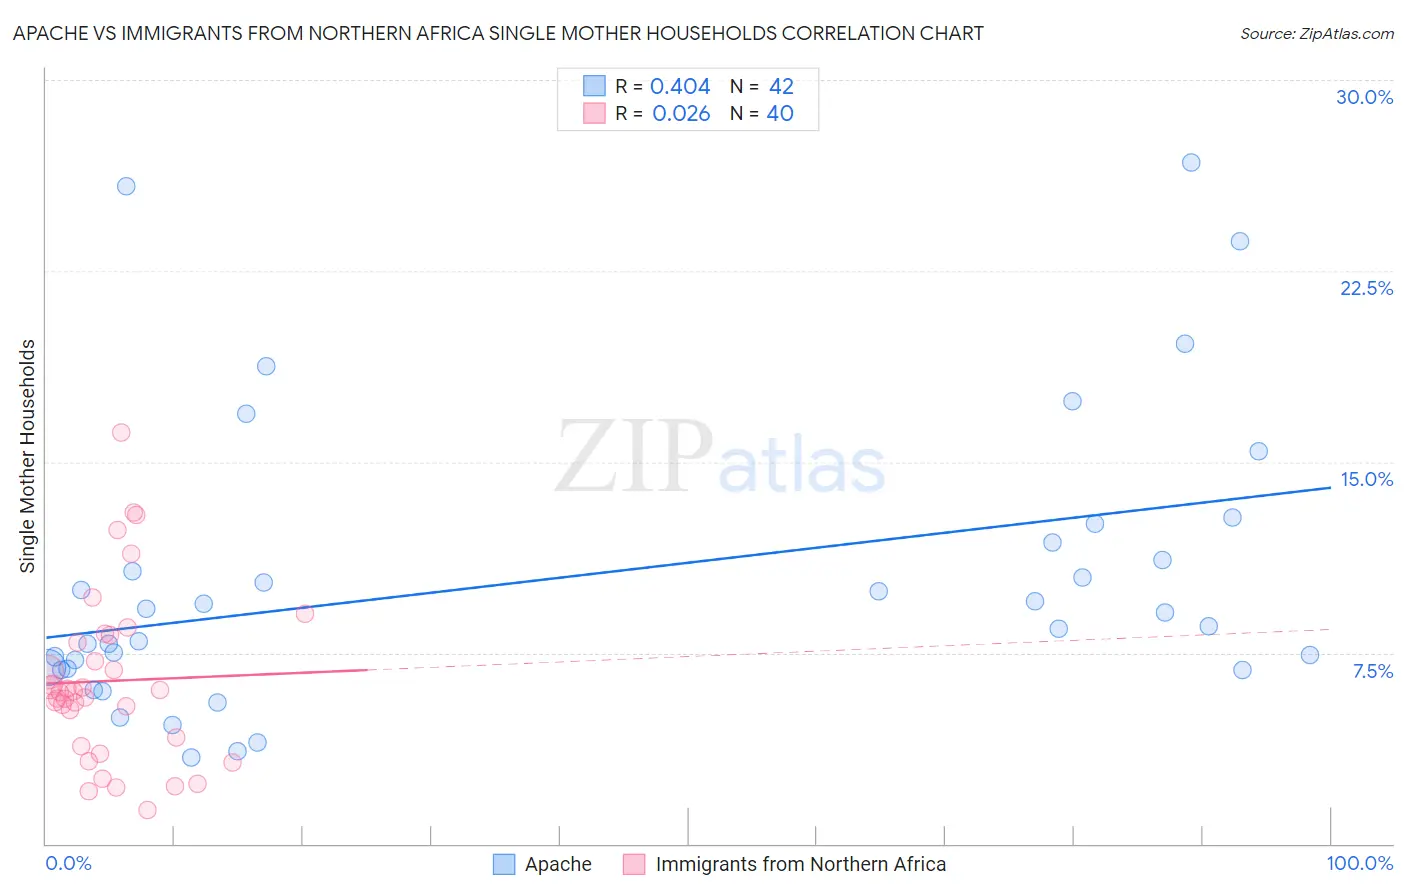
Apache vs Immigrants from Northern Africa Single Mother Households Correlation Chart
The statistical analysis conducted on geographies consisting of 230,770,959 people shows a moderate positive correlation between the proportion of Apache and percentage of single mother households in the United States with a correlation coefficient (R) of 0.404 and weighted average of 7.9%. Similarly, the statistical analysis conducted on geographies consisting of 320,525,361 people shows no correlation between the proportion of Immigrants from Northern Africa and percentage of single mother households in the United States with a correlation coefficient (R) of 0.026 and weighted average of 6.2%, a difference of 27.5%.
Single Mother Households Correlation Summary
| Measurement | Apache | Immigrants from Northern Africa |
| Minimum | 3.4% | 1.3% |
| Maximum | 26.8% | 16.1% |
| Range | 23.4% | 14.8% |
| Mean | 10.4% | 6.4% |
| Median | 8.8% | 6.0% |
| Interquartile 25% (IQ1) | 6.9% | 4.0% |
| Interquartile 75% (IQ3) | 11.8% | 8.0% |
| Interquartile Range (IQR) | 5.0% | 4.0% |
| Standard Deviation (Sample) | 5.7% | 3.3% |
| Standard Deviation (Population) | 5.7% | 3.3% |
Similar Demographics by Single Mother Households
Demographics Similar to Apache by Single Mother Households
In terms of single mother households, the demographic groups most similar to Apache are Immigrants from Cameroon (7.9%, a difference of 0.10%), Barbadian (7.9%, a difference of 0.29%), Immigrants from Latin America (7.9%, a difference of 0.35%), Hispanic or Latino (7.9%, a difference of 0.39%), and Ghanaian (7.8%, a difference of 0.46%).
| Demographics | Rating | Rank | Single Mother Households |
| Immigrants | Guatemala | 0.0 /100 | #287 | Tragic 7.7% |
| Sierra Leoneans | 0.0 /100 | #288 | Tragic 7.7% |
| Sub-Saharan Africans | 0.0 /100 | #289 | Tragic 7.8% |
| Immigrants | Nigeria | 0.0 /100 | #290 | Tragic 7.8% |
| West Indians | 0.0 /100 | #291 | Tragic 7.8% |
| Ghanaians | 0.0 /100 | #292 | Tragic 7.8% |
| Immigrants | Cameroon | 0.0 /100 | #293 | Tragic 7.9% |
| Apache | 0.0 /100 | #294 | Tragic 7.9% |
| Barbadians | 0.0 /100 | #295 | Tragic 7.9% |
| Immigrants | Latin America | 0.0 /100 | #296 | Tragic 7.9% |
| Hispanics or Latinos | 0.0 /100 | #297 | Tragic 7.9% |
| Immigrants | West Indies | 0.0 /100 | #298 | Tragic 7.9% |
| Houma | 0.0 /100 | #299 | Tragic 7.9% |
| Mexicans | 0.0 /100 | #300 | Tragic 8.0% |
| Chippewa | 0.0 /100 | #301 | Tragic 8.0% |
Demographics Similar to Immigrants from Northern Africa by Single Mother Households
In terms of single mother households, the demographic groups most similar to Immigrants from Northern Africa are Immigrants from Syria (6.2%, a difference of 0.070%), Alsatian (6.2%, a difference of 0.090%), Immigrants from Zimbabwe (6.2%, a difference of 0.25%), Sri Lankan (6.2%, a difference of 0.50%), and Immigrants from Germany (6.1%, a difference of 0.60%).
| Demographics | Rating | Rank | Single Mother Households |
| Chileans | 74.2 /100 | #157 | Good 6.1% |
| Celtics | 73.3 /100 | #158 | Good 6.1% |
| Yugoslavians | 73.1 /100 | #159 | Good 6.1% |
| Iraqis | 73.0 /100 | #160 | Good 6.1% |
| Immigrants | Germany | 72.4 /100 | #161 | Good 6.1% |
| Immigrants | Zimbabwe | 69.9 /100 | #162 | Good 6.2% |
| Alsatians | 68.7 /100 | #163 | Good 6.2% |
| Immigrants | Northern Africa | 68.0 /100 | #164 | Good 6.2% |
| Immigrants | Syria | 67.4 /100 | #165 | Good 6.2% |
| Sri Lankans | 63.9 /100 | #166 | Good 6.2% |
| Brazilians | 59.1 /100 | #167 | Average 6.2% |
| Immigrants | Chile | 58.3 /100 | #168 | Average 6.3% |
| Puget Sound Salish | 58.1 /100 | #169 | Average 6.3% |
| Immigrants | Oceania | 54.6 /100 | #170 | Average 6.3% |
| Afghans | 52.5 /100 | #171 | Average 6.3% |