Albanian vs Immigrants from Bangladesh Single Father Households
COMPARE
Albanian
Immigrants from Bangladesh
Single Father Households
Single Father Households Comparison
Albanians
Immigrants from Bangladesh
2.0%
SINGLE FATHER HOUSEHOLDS
100.0/ 100
METRIC RATING
35th/ 347
METRIC RANK
2.1%
SINGLE FATHER HOUSEHOLDS
99.8/ 100
METRIC RATING
73rd/ 347
METRIC RANK
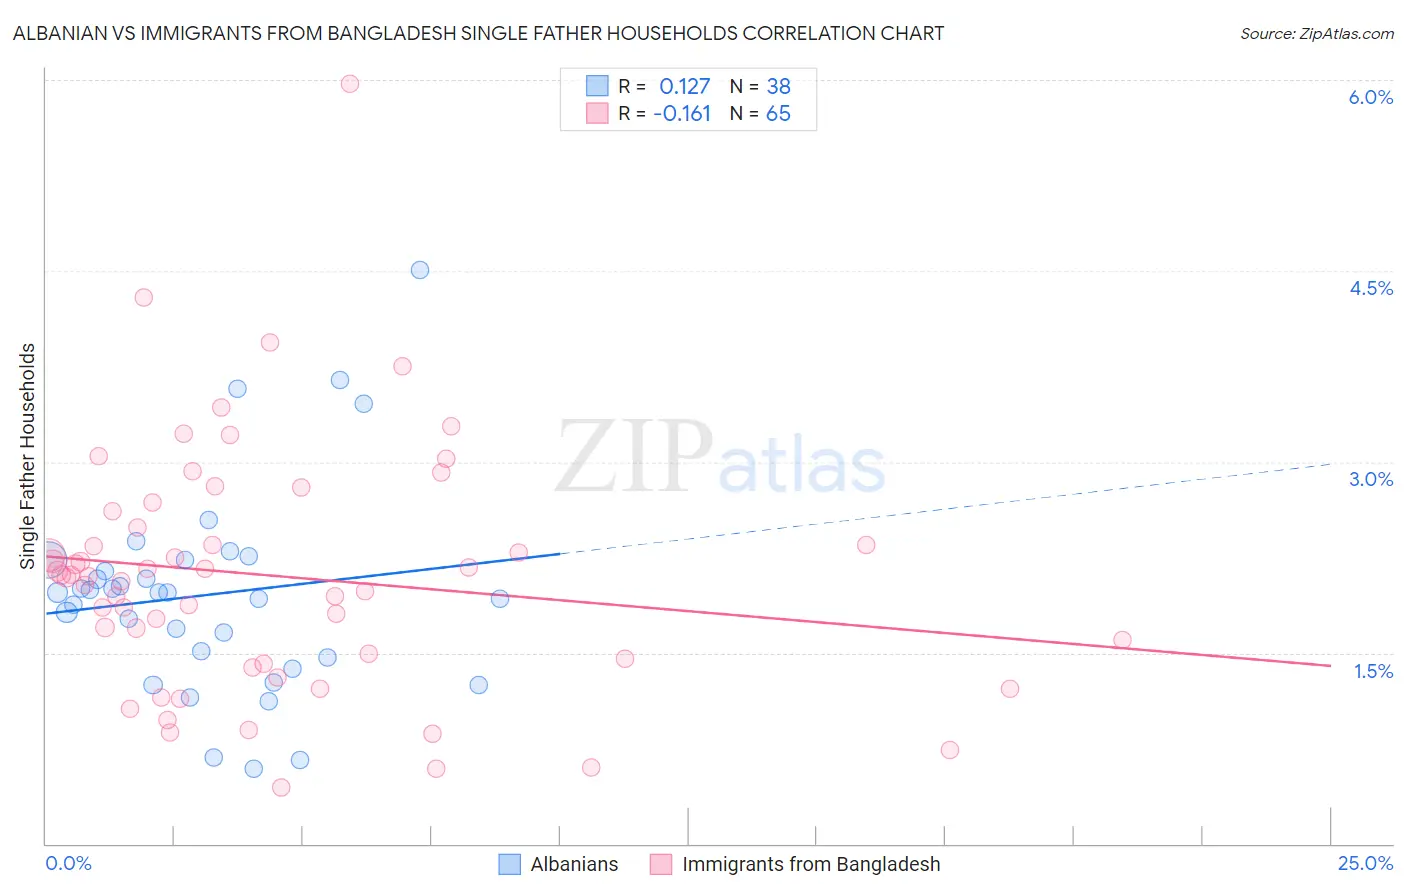
Albanian vs Immigrants from Bangladesh Single Father Households Correlation Chart
The statistical analysis conducted on geographies consisting of 192,201,260 people shows a poor positive correlation between the proportion of Albanians and percentage of single father households in the United States with a correlation coefficient (R) of 0.127 and weighted average of 2.0%. Similarly, the statistical analysis conducted on geographies consisting of 202,870,334 people shows a poor negative correlation between the proportion of Immigrants from Bangladesh and percentage of single father households in the United States with a correlation coefficient (R) of -0.161 and weighted average of 2.1%, a difference of 4.4%.
Single Father Households Correlation Summary
| Measurement | Albanian | Immigrants from Bangladesh |
| Minimum | 0.59% | 0.44% |
| Maximum | 4.5% | 6.0% |
| Range | 3.9% | 5.5% |
| Mean | 2.0% | 2.1% |
| Median | 2.0% | 2.1% |
| Interquartile 25% (IQ1) | 1.5% | 1.4% |
| Interquartile 75% (IQ3) | 2.2% | 2.5% |
| Interquartile Range (IQR) | 0.77% | 1.1% |
| Standard Deviation (Sample) | 0.81% | 0.96% |
| Standard Deviation (Population) | 0.80% | 0.96% |
Similar Demographics by Single Father Households
Demographics Similar to Albanians by Single Father Households
In terms of single father households, the demographic groups most similar to Albanians are Immigrants from Belgium (2.0%, a difference of 0.11%), Immigrants from St. Vincent and the Grenadines (2.0%, a difference of 0.13%), Immigrants from Australia (2.0%, a difference of 0.32%), Turkish (2.0%, a difference of 0.34%), and Immigrants from Eastern Europe (2.0%, a difference of 0.43%).
| Demographics | Rating | Rank | Single Father Households |
| Immigrants | Japan | 100.0 /100 | #28 | Exceptional 2.0% |
| Bulgarians | 100.0 /100 | #29 | Exceptional 2.0% |
| Cambodians | 100.0 /100 | #30 | Exceptional 2.0% |
| Israelis | 100.0 /100 | #31 | Exceptional 2.0% |
| Chinese | 100.0 /100 | #32 | Exceptional 2.0% |
| Turks | 100.0 /100 | #33 | Exceptional 2.0% |
| Immigrants | Australia | 100.0 /100 | #34 | Exceptional 2.0% |
| Albanians | 100.0 /100 | #35 | Exceptional 2.0% |
| Immigrants | Belgium | 100.0 /100 | #36 | Exceptional 2.0% |
| Immigrants | St. Vincent and the Grenadines | 100.0 /100 | #37 | Exceptional 2.0% |
| Immigrants | Eastern Europe | 100.0 /100 | #38 | Exceptional 2.0% |
| Immigrants | Sri Lanka | 100.0 /100 | #39 | Exceptional 2.0% |
| Immigrants | Bulgaria | 100.0 /100 | #40 | Exceptional 2.0% |
| Immigrants | Turkey | 100.0 /100 | #41 | Exceptional 2.0% |
| Macedonians | 100.0 /100 | #42 | Exceptional 2.0% |
Demographics Similar to Immigrants from Bangladesh by Single Father Households
In terms of single father households, the demographic groups most similar to Immigrants from Bangladesh are Immigrants from Egypt (2.1%, a difference of 0.0%), Immigrants from Spain (2.1%, a difference of 0.14%), Immigrants from Kuwait (2.1%, a difference of 0.15%), Egyptian (2.1%, a difference of 0.16%), and Immigrants from Sweden (2.1%, a difference of 0.29%).
| Demographics | Rating | Rank | Single Father Households |
| Immigrants | Western Asia | 99.8 /100 | #66 | Exceptional 2.1% |
| Immigrants | Italy | 99.8 /100 | #67 | Exceptional 2.1% |
| Immigrants | Denmark | 99.8 /100 | #68 | Exceptional 2.1% |
| Immigrants | Romania | 99.8 /100 | #69 | Exceptional 2.1% |
| Egyptians | 99.8 /100 | #70 | Exceptional 2.1% |
| Immigrants | Kuwait | 99.8 /100 | #71 | Exceptional 2.1% |
| Immigrants | Spain | 99.8 /100 | #72 | Exceptional 2.1% |
| Immigrants | Bangladesh | 99.8 /100 | #73 | Exceptional 2.1% |
| Immigrants | Egypt | 99.8 /100 | #74 | Exceptional 2.1% |
| Immigrants | Sweden | 99.8 /100 | #75 | Exceptional 2.1% |
| Immigrants | Scotland | 99.8 /100 | #76 | Exceptional 2.1% |
| Immigrants | Saudi Arabia | 99.8 /100 | #77 | Exceptional 2.1% |
| Estonians | 99.7 /100 | #78 | Exceptional 2.1% |
| Immigrants | Asia | 99.7 /100 | #79 | Exceptional 2.1% |
| Immigrants | South Africa | 99.7 /100 | #80 | Exceptional 2.1% |