Zimbabwean vs Immigrants from Barbados 8th Grade
COMPARE
Zimbabwean
Immigrants from Barbados
8th Grade
8th Grade Comparison
Zimbabweans
Immigrants from Barbados
96.5%
8TH GRADE
99.4/ 100
METRIC RATING
75th/ 347
METRIC RANK
94.5%
8TH GRADE
0.0/ 100
METRIC RATING
285th/ 347
METRIC RANK
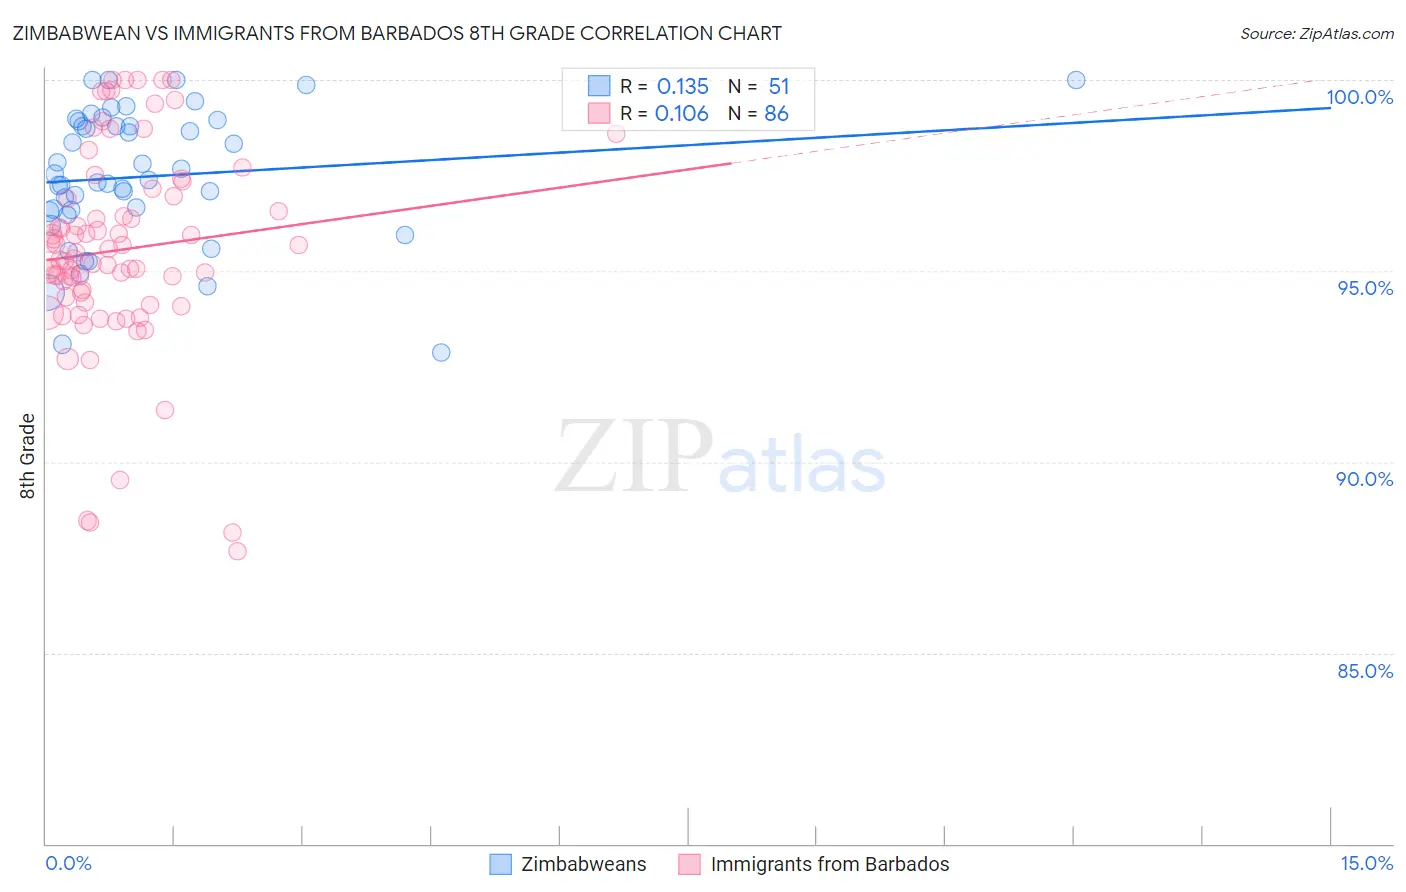
Zimbabwean vs Immigrants from Barbados 8th Grade Correlation Chart
The statistical analysis conducted on geographies consisting of 69,203,423 people shows a poor positive correlation between the proportion of Zimbabweans and percentage of population with at least 8th grade education in the United States with a correlation coefficient (R) of 0.135 and weighted average of 96.5%. Similarly, the statistical analysis conducted on geographies consisting of 112,787,165 people shows a poor positive correlation between the proportion of Immigrants from Barbados and percentage of population with at least 8th grade education in the United States with a correlation coefficient (R) of 0.106 and weighted average of 94.5%, a difference of 2.1%.
8th Grade Correlation Summary
| Measurement | Zimbabwean | Immigrants from Barbados |
| Minimum | 92.9% | 87.6% |
| Maximum | 100.0% | 100.0% |
| Range | 7.1% | 12.4% |
| Mean | 97.5% | 95.6% |
| Median | 97.4% | 95.4% |
| Interquartile 25% (IQ1) | 96.6% | 94.3% |
| Interquartile 75% (IQ3) | 98.9% | 96.9% |
| Interquartile Range (IQR) | 2.4% | 2.6% |
| Standard Deviation (Sample) | 1.8% | 2.7% |
| Standard Deviation (Population) | 1.7% | 2.7% |
Similar Demographics by 8th Grade
Demographics Similar to Zimbabweans by 8th Grade
In terms of 8th grade, the demographic groups most similar to Zimbabweans are Immigrants from Netherlands (96.5%, a difference of 0.0%), Immigrants from Ireland (96.5%, a difference of 0.010%), Cypriot (96.5%, a difference of 0.010%), Yugoslavian (96.5%, a difference of 0.010%), and New Zealander (96.6%, a difference of 0.020%).
| Demographics | Rating | Rank | 8th Grade |
| Creek | 99.7 /100 | #68 | Exceptional 96.6% |
| Americans | 99.7 /100 | #69 | Exceptional 96.6% |
| Immigrants | Lithuania | 99.6 /100 | #70 | Exceptional 96.6% |
| New Zealanders | 99.5 /100 | #71 | Exceptional 96.6% |
| Immigrants | England | 99.5 /100 | #72 | Exceptional 96.6% |
| Arapaho | 99.5 /100 | #73 | Exceptional 96.6% |
| Immigrants | Ireland | 99.5 /100 | #74 | Exceptional 96.5% |
| Zimbabweans | 99.4 /100 | #75 | Exceptional 96.5% |
| Immigrants | Netherlands | 99.4 /100 | #76 | Exceptional 96.5% |
| Cypriots | 99.4 /100 | #77 | Exceptional 96.5% |
| Yugoslavians | 99.4 /100 | #78 | Exceptional 96.5% |
| Puget Sound Salish | 99.3 /100 | #79 | Exceptional 96.5% |
| Delaware | 99.2 /100 | #80 | Exceptional 96.5% |
| Romanians | 99.2 /100 | #81 | Exceptional 96.5% |
| Turks | 99.2 /100 | #82 | Exceptional 96.5% |
Demographics Similar to Immigrants from Barbados by 8th Grade
In terms of 8th grade, the demographic groups most similar to Immigrants from Barbados are Immigrants from Philippines (94.6%, a difference of 0.030%), Immigrants from St. Vincent and the Grenadines (94.6%, a difference of 0.040%), Immigrants from Peru (94.5%, a difference of 0.050%), Tohono O'odham (94.5%, a difference of 0.060%), and Immigrants from Eritrea (94.6%, a difference of 0.070%).
| Demographics | Rating | Rank | 8th Grade |
| Armenians | 0.1 /100 | #278 | Tragic 94.7% |
| Immigrants | Trinidad and Tobago | 0.1 /100 | #279 | Tragic 94.6% |
| Barbadians | 0.1 /100 | #280 | Tragic 94.6% |
| Immigrants | Bolivia | 0.1 /100 | #281 | Tragic 94.6% |
| Immigrants | Eritrea | 0.1 /100 | #282 | Tragic 94.6% |
| Immigrants | St. Vincent and the Grenadines | 0.1 /100 | #283 | Tragic 94.6% |
| Immigrants | Philippines | 0.1 /100 | #284 | Tragic 94.6% |
| Immigrants | Barbados | 0.0 /100 | #285 | Tragic 94.5% |
| Immigrants | Peru | 0.0 /100 | #286 | Tragic 94.5% |
| Tohono O'odham | 0.0 /100 | #287 | Tragic 94.5% |
| Malaysians | 0.0 /100 | #288 | Tragic 94.5% |
| British West Indians | 0.0 /100 | #289 | Tragic 94.4% |
| Immigrants | West Indies | 0.0 /100 | #290 | Tragic 94.3% |
| Immigrants | Grenada | 0.0 /100 | #291 | Tragic 94.3% |
| Bangladeshis | 0.0 /100 | #292 | Tragic 94.3% |