Yaqui vs Immigrants from Egypt 3rd Grade
COMPARE
Yaqui
Immigrants from Egypt
3rd Grade
3rd Grade Comparison
Yaqui
Immigrants from Egypt
97.3%
3RD GRADE
0.3/ 100
METRIC RATING
266th/ 347
METRIC RANK
97.7%
3RD GRADE
26.8/ 100
METRIC RATING
195th/ 347
METRIC RANK
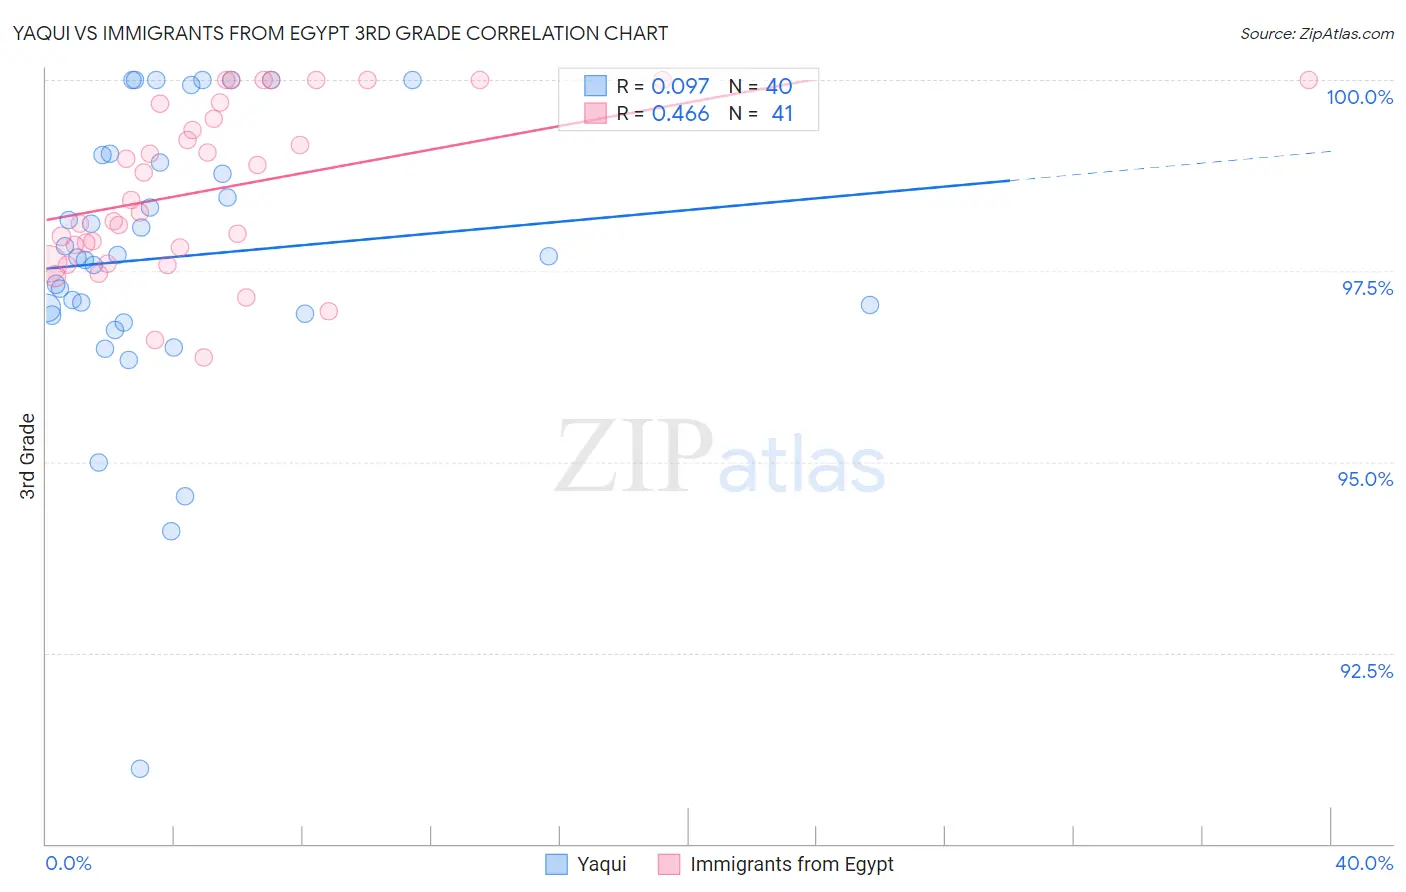
Yaqui vs Immigrants from Egypt 3rd Grade Correlation Chart
The statistical analysis conducted on geographies consisting of 107,732,380 people shows a slight positive correlation between the proportion of Yaqui and percentage of population with at least 3rd grade education in the United States with a correlation coefficient (R) of 0.097 and weighted average of 97.3%. Similarly, the statistical analysis conducted on geographies consisting of 245,485,794 people shows a moderate positive correlation between the proportion of Immigrants from Egypt and percentage of population with at least 3rd grade education in the United States with a correlation coefficient (R) of 0.466 and weighted average of 97.7%, a difference of 0.42%.
3rd Grade Correlation Summary
| Measurement | Yaqui | Immigrants from Egypt |
| Minimum | 91.0% | 96.4% |
| Maximum | 100.0% | 100.0% |
| Range | 9.0% | 3.6% |
| Mean | 97.7% | 98.6% |
| Median | 97.7% | 98.4% |
| Interquartile 25% (IQ1) | 96.9% | 97.7% |
| Interquartile 75% (IQ3) | 99.0% | 99.7% |
| Interquartile Range (IQR) | 2.0% | 2.0% |
| Standard Deviation (Sample) | 1.9% | 1.1% |
| Standard Deviation (Population) | 1.8% | 1.1% |
Similar Demographics by 3rd Grade
Demographics Similar to Yaqui by 3rd Grade
In terms of 3rd grade, the demographic groups most similar to Yaqui are Immigrants from Nigeria (97.3%, a difference of 0.0%), Immigrants from Jamaica (97.3%, a difference of 0.010%), Cuban (97.3%, a difference of 0.010%), Fijian (97.3%, a difference of 0.010%), and Taiwanese (97.3%, a difference of 0.020%).
| Demographics | Rating | Rank | 3rd Grade |
| Armenians | 0.4 /100 | #259 | Tragic 97.3% |
| Immigrants | Ethiopia | 0.4 /100 | #260 | Tragic 97.3% |
| Immigrants | South America | 0.4 /100 | #261 | Tragic 97.3% |
| Immigrants | Sierra Leone | 0.4 /100 | #262 | Tragic 97.3% |
| Taiwanese | 0.3 /100 | #263 | Tragic 97.3% |
| West Indians | 0.3 /100 | #264 | Tragic 97.3% |
| Immigrants | Jamaica | 0.3 /100 | #265 | Tragic 97.3% |
| Yaqui | 0.3 /100 | #266 | Tragic 97.3% |
| Immigrants | Nigeria | 0.3 /100 | #267 | Tragic 97.3% |
| Cubans | 0.2 /100 | #268 | Tragic 97.3% |
| Fijians | 0.2 /100 | #269 | Tragic 97.3% |
| Immigrants | China | 0.2 /100 | #270 | Tragic 97.2% |
| Puerto Ricans | 0.2 /100 | #271 | Tragic 97.2% |
| Ghanaians | 0.1 /100 | #272 | Tragic 97.2% |
| Immigrants | Peru | 0.1 /100 | #273 | Tragic 97.2% |
Demographics Similar to Immigrants from Egypt by 3rd Grade
In terms of 3rd grade, the demographic groups most similar to Immigrants from Egypt are Immigrants from Uganda (97.7%, a difference of 0.0%), Paraguayan (97.7%, a difference of 0.0%), Hawaiian (97.7%, a difference of 0.0%), Black/African American (97.7%, a difference of 0.010%), and Mongolian (97.7%, a difference of 0.010%).
| Demographics | Rating | Rank | 3rd Grade |
| Immigrants | Taiwan | 34.2 /100 | #188 | Fair 97.7% |
| Pakistanis | 34.2 /100 | #189 | Fair 97.7% |
| Panamanians | 31.5 /100 | #190 | Fair 97.7% |
| Blacks/African Americans | 29.6 /100 | #191 | Fair 97.7% |
| Mongolians | 29.1 /100 | #192 | Fair 97.7% |
| Immigrants | Kenya | 28.2 /100 | #193 | Fair 97.7% |
| Immigrants | Uganda | 27.4 /100 | #194 | Fair 97.7% |
| Immigrants | Egypt | 26.8 /100 | #195 | Fair 97.7% |
| Paraguayans | 26.2 /100 | #196 | Fair 97.7% |
| Hawaiians | 25.7 /100 | #197 | Fair 97.7% |
| Guamanians/Chamorros | 23.6 /100 | #198 | Fair 97.7% |
| Immigrants | Ukraine | 22.7 /100 | #199 | Fair 97.7% |
| Immigrants | Albania | 22.6 /100 | #200 | Fair 97.7% |
| Immigrants | Lebanon | 21.7 /100 | #201 | Fair 97.7% |
| Immigrants | Southern Europe | 17.7 /100 | #202 | Poor 97.6% |