Immigrants from Canada vs Scottish High School Diploma
COMPARE
Immigrants from Canada
Scottish
High School Diploma
High School Diploma Comparison
Immigrants from Canada
Scottish
91.1%
HIGH SCHOOL DIPLOMA
99.7/ 100
METRIC RATING
56th/ 347
METRIC RANK
91.4%
HIGH SCHOOL DIPLOMA
99.9/ 100
METRIC RATING
34th/ 347
METRIC RANK
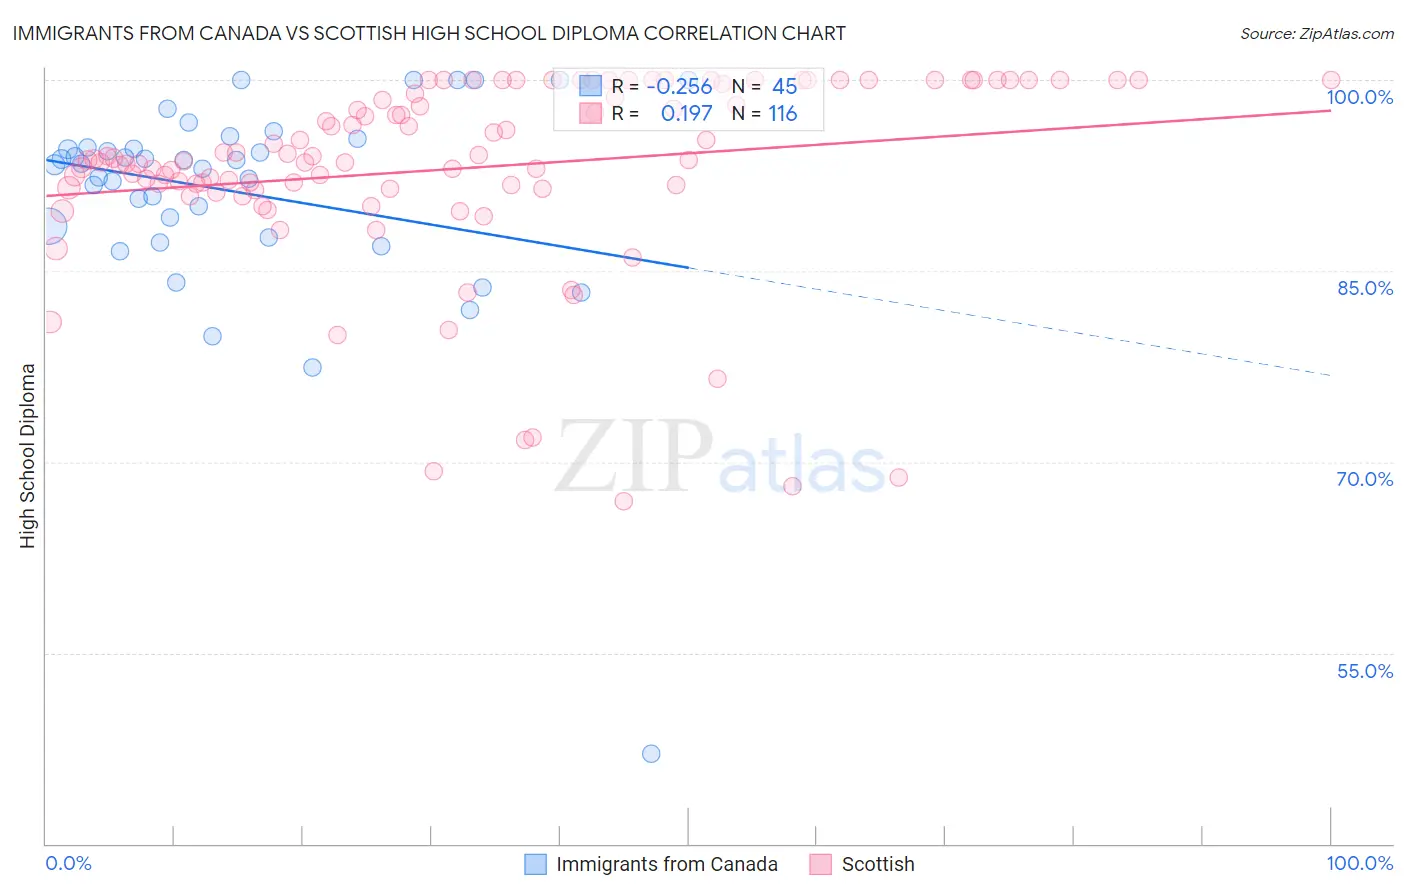
Immigrants from Canada vs Scottish High School Diploma Correlation Chart
The statistical analysis conducted on geographies consisting of 459,397,064 people shows a weak negative correlation between the proportion of Immigrants from Canada and percentage of population with at least high school diploma education in the United States with a correlation coefficient (R) of -0.256 and weighted average of 91.1%. Similarly, the statistical analysis conducted on geographies consisting of 567,141,165 people shows a poor positive correlation between the proportion of Scottish and percentage of population with at least high school diploma education in the United States with a correlation coefficient (R) of 0.197 and weighted average of 91.4%, a difference of 0.35%.
High School Diploma Correlation Summary
| Measurement | Immigrants from Canada | Scottish |
| Minimum | 47.1% | 66.9% |
| Maximum | 100.0% | 100.0% |
| Range | 52.9% | 33.1% |
| Mean | 91.1% | 93.0% |
| Median | 93.4% | 93.7% |
| Interquartile 25% (IQ1) | 88.1% | 91.5% |
| Interquartile 75% (IQ3) | 95.1% | 99.3% |
| Interquartile Range (IQR) | 7.0% | 7.8% |
| Standard Deviation (Sample) | 8.7% | 7.4% |
| Standard Deviation (Population) | 8.6% | 7.4% |
Similar Demographics by High School Diploma
Demographics Similar to Immigrants from Canada by High School Diploma
In terms of high school diploma, the demographic groups most similar to Immigrants from Canada are Zimbabwean (91.1%, a difference of 0.020%), Serbian (91.1%, a difference of 0.030%), Slavic (91.0%, a difference of 0.030%), Immigrants from North America (91.0%, a difference of 0.030%), and Macedonian (91.1%, a difference of 0.040%).
| Demographics | Rating | Rank | High School Diploma |
| Bhutanese | 99.8 /100 | #49 | Exceptional 91.2% |
| Welsh | 99.8 /100 | #50 | Exceptional 91.2% |
| New Zealanders | 99.7 /100 | #51 | Exceptional 91.1% |
| Immigrants | Sweden | 99.7 /100 | #52 | Exceptional 91.1% |
| Immigrants | Belgium | 99.7 /100 | #53 | Exceptional 91.1% |
| Macedonians | 99.7 /100 | #54 | Exceptional 91.1% |
| Serbians | 99.7 /100 | #55 | Exceptional 91.1% |
| Immigrants | Canada | 99.7 /100 | #56 | Exceptional 91.1% |
| Zimbabweans | 99.7 /100 | #57 | Exceptional 91.1% |
| Slavs | 99.7 /100 | #58 | Exceptional 91.0% |
| Immigrants | North America | 99.7 /100 | #59 | Exceptional 91.0% |
| Immigrants | Japan | 99.6 /100 | #60 | Exceptional 91.0% |
| Immigrants | Taiwan | 99.6 /100 | #61 | Exceptional 91.0% |
| Austrians | 99.6 /100 | #62 | Exceptional 91.0% |
| Immigrants | Netherlands | 99.6 /100 | #63 | Exceptional 91.0% |
Demographics Similar to Scottish by High School Diploma
In terms of high school diploma, the demographic groups most similar to Scottish are English (91.4%, a difference of 0.010%), Okinawan (91.4%, a difference of 0.010%), Iranian (91.4%, a difference of 0.020%), Immigrants from Northern Europe (91.4%, a difference of 0.020%), and European (91.4%, a difference of 0.030%).
| Demographics | Rating | Rank | High School Diploma |
| Cypriots | 99.9 /100 | #27 | Exceptional 91.5% |
| Tlingit-Haida | 99.9 /100 | #28 | Exceptional 91.4% |
| Europeans | 99.9 /100 | #29 | Exceptional 91.4% |
| Iranians | 99.9 /100 | #30 | Exceptional 91.4% |
| Immigrants | Northern Europe | 99.9 /100 | #31 | Exceptional 91.4% |
| English | 99.9 /100 | #32 | Exceptional 91.4% |
| Okinawans | 99.9 /100 | #33 | Exceptional 91.4% |
| Scottish | 99.9 /100 | #34 | Exceptional 91.4% |
| Irish | 99.9 /100 | #35 | Exceptional 91.4% |
| Tsimshian | 99.9 /100 | #36 | Exceptional 91.3% |
| Immigrants | Ireland | 99.9 /100 | #37 | Exceptional 91.3% |
| Immigrants | Scotland | 99.8 /100 | #38 | Exceptional 91.3% |
| Dutch | 99.8 /100 | #39 | Exceptional 91.3% |
| Immigrants | Lithuania | 99.8 /100 | #40 | Exceptional 91.3% |
| Immigrants | Australia | 99.8 /100 | #41 | Exceptional 91.3% |