Puget Sound Salish vs Immigrants from Germany 12th Grade, No Diploma
COMPARE
Puget Sound Salish
Immigrants from Germany
12th Grade, No Diploma
12th Grade, No Diploma Comparison
Puget Sound Salish
Immigrants from Germany
92.0%
12TH GRADE, NO DIPLOMA
95.8/ 100
METRIC RATING
118th/ 347
METRIC RANK
92.0%
12TH GRADE, NO DIPLOMA
95.5/ 100
METRIC RATING
119th/ 347
METRIC RANK
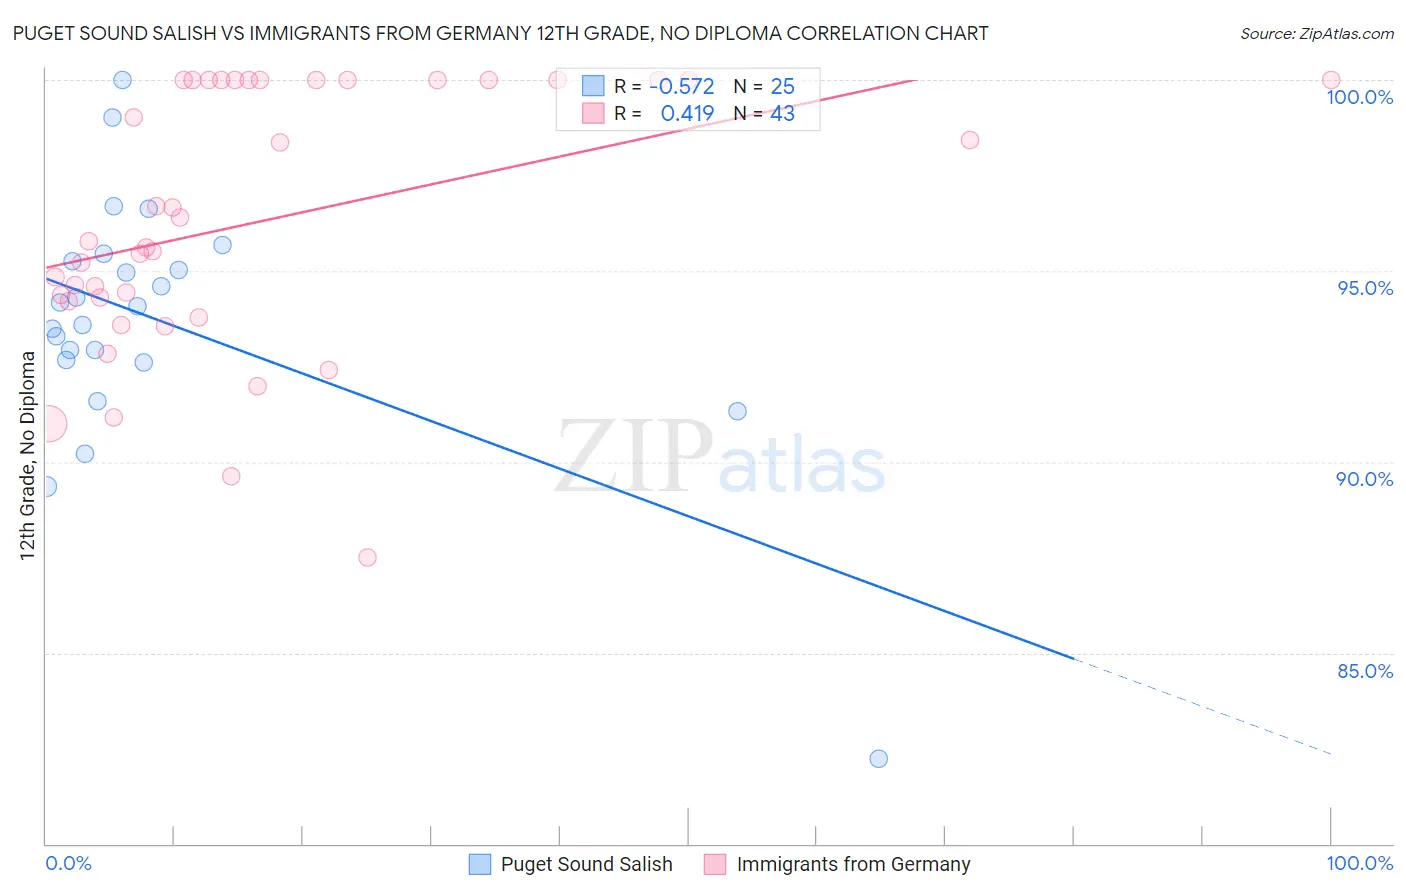
Puget Sound Salish vs Immigrants from Germany 12th Grade, No Diploma Correlation Chart
The statistical analysis conducted on geographies consisting of 46,155,775 people shows a substantial negative correlation between the proportion of Puget Sound Salish and percentage of population with at least 12th grade (no diploma) education in the United States with a correlation coefficient (R) of -0.572 and weighted average of 92.0%. Similarly, the statistical analysis conducted on geographies consisting of 463,886,936 people shows a moderate positive correlation between the proportion of Immigrants from Germany and percentage of population with at least 12th grade (no diploma) education in the United States with a correlation coefficient (R) of 0.419 and weighted average of 92.0%, a difference of 0.030%.
12th Grade, No Diploma Correlation Summary
| Measurement | Puget Sound Salish | Immigrants from Germany |
| Minimum | 82.2% | 87.5% |
| Maximum | 100.0% | 100.0% |
| Range | 17.8% | 12.5% |
| Mean | 93.7% | 96.3% |
| Median | 94.1% | 95.8% |
| Interquartile 25% (IQ1) | 92.6% | 94.2% |
| Interquartile 75% (IQ3) | 95.3% | 100.0% |
| Interquartile Range (IQR) | 2.7% | 5.8% |
| Standard Deviation (Sample) | 3.4% | 3.4% |
| Standard Deviation (Population) | 3.3% | 3.4% |
Demographics Similar to Puget Sound Salish and Immigrants from Germany by 12th Grade, No Diploma
In terms of 12th grade, no diploma, the demographic groups most similar to Puget Sound Salish are Aleut (92.1%, a difference of 0.040%), Immigrants from Eastern Europe (92.1%, a difference of 0.040%), Immigrants from Zimbabwe (92.1%, a difference of 0.050%), Yugoslavian (92.1%, a difference of 0.050%), and Immigrants from Sri Lanka (92.1%, a difference of 0.050%). Similarly, the demographic groups most similar to Immigrants from Germany are Immigrants from Eastern Europe (92.1%, a difference of 0.060%), Immigrants from Sri Lanka (92.1%, a difference of 0.070%), Aleut (92.1%, a difference of 0.070%), Immigrants from Zimbabwe (92.1%, a difference of 0.080%), and Yugoslavian (92.1%, a difference of 0.080%).
| Demographics | Rating | Rank | 12th Grade, No Diploma |
| Jordanians | 97.2 /100 | #108 | Exceptional 92.2% |
| Immigrants | Hungary | 97.0 /100 | #109 | Exceptional 92.1% |
| Palestinians | 97.0 /100 | #110 | Exceptional 92.1% |
| Immigrants | Greece | 96.9 /100 | #111 | Exceptional 92.1% |
| Israelis | 96.8 /100 | #112 | Exceptional 92.1% |
| Immigrants | Zimbabwe | 96.5 /100 | #113 | Exceptional 92.1% |
| Yugoslavians | 96.5 /100 | #114 | Exceptional 92.1% |
| Immigrants | Sri Lanka | 96.4 /100 | #115 | Exceptional 92.1% |
| Aleuts | 96.3 /100 | #116 | Exceptional 92.1% |
| Immigrants | Eastern Europe | 96.3 /100 | #117 | Exceptional 92.1% |
| Puget Sound Salish | 95.8 /100 | #118 | Exceptional 92.0% |
| Immigrants | Germany | 95.5 /100 | #119 | Exceptional 92.0% |
| Immigrants | Kazakhstan | 94.2 /100 | #120 | Exceptional 91.9% |
| Menominee | 93.5 /100 | #121 | Exceptional 91.9% |
| Ottawa | 93.1 /100 | #122 | Exceptional 91.9% |
| Egyptians | 92.5 /100 | #123 | Exceptional 91.9% |
| Immigrants | Ukraine | 91.6 /100 | #124 | Exceptional 91.8% |
| Whites/Caucasians | 91.6 /100 | #125 | Exceptional 91.8% |
| Basques | 91.3 /100 | #126 | Exceptional 91.8% |
| Immigrants | Jordan | 91.0 /100 | #127 | Exceptional 91.8% |
| Mongolians | 89.9 /100 | #128 | Excellent 91.8% |