Irish vs Comanche 1st Grade
COMPARE
Irish
Comanche
1st Grade
1st Grade Comparison
Irish
Comanche
98.6%
1ST GRADE
100.0/ 100
METRIC RATING
19th/ 347
METRIC RANK
98.0%
1ST GRADE
66.9/ 100
METRIC RATING
155th/ 347
METRIC RANK
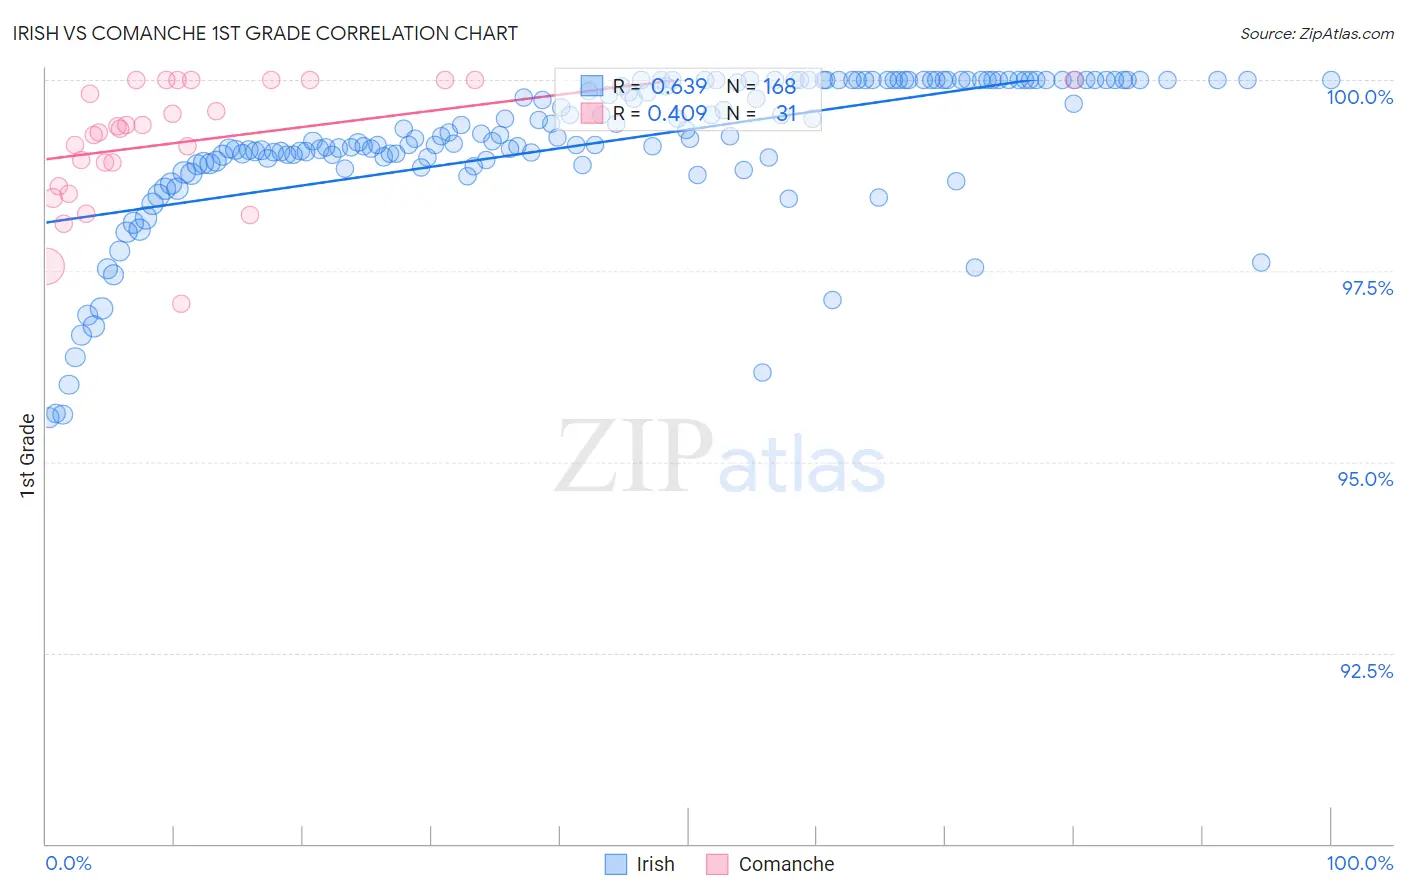
Irish vs Comanche 1st Grade Correlation Chart
The statistical analysis conducted on geographies consisting of 580,708,963 people shows a significant positive correlation between the proportion of Irish and percentage of population with at least 1st grade education in the United States with a correlation coefficient (R) of 0.639 and weighted average of 98.6%. Similarly, the statistical analysis conducted on geographies consisting of 109,786,530 people shows a moderate positive correlation between the proportion of Comanche and percentage of population with at least 1st grade education in the United States with a correlation coefficient (R) of 0.409 and weighted average of 98.0%, a difference of 0.63%.
1st Grade Correlation Summary
| Measurement | Irish | Comanche |
| Minimum | 95.6% | 97.1% |
| Maximum | 100.0% | 100.0% |
| Range | 4.4% | 2.9% |
| Mean | 99.2% | 99.2% |
| Median | 99.3% | 99.4% |
| Interquartile 25% (IQ1) | 99.0% | 98.6% |
| Interquartile 75% (IQ3) | 100.0% | 100.0% |
| Interquartile Range (IQR) | 1.0% | 1.4% |
| Standard Deviation (Sample) | 0.97% | 0.78% |
| Standard Deviation (Population) | 0.96% | 0.77% |
Similar Demographics by 1st Grade
Demographics Similar to Irish by 1st Grade
In terms of 1st grade, the demographic groups most similar to Irish are Sioux (98.6%, a difference of 0.010%), Arapaho (98.6%, a difference of 0.010%), Pennsylvania German (98.6%, a difference of 0.010%), Finnish (98.6%, a difference of 0.010%), and Lithuanian (98.6%, a difference of 0.010%).
| Demographics | Rating | Rank | 1st Grade |
| Slovenes | 100.0 /100 | #12 | Exceptional 98.7% |
| Carpatho Rusyns | 100.0 /100 | #13 | Exceptional 98.6% |
| English | 100.0 /100 | #14 | Exceptional 98.6% |
| Swedes | 100.0 /100 | #15 | Exceptional 98.6% |
| Aleuts | 100.0 /100 | #16 | Exceptional 98.6% |
| Scottish | 100.0 /100 | #17 | Exceptional 98.6% |
| Dutch | 100.0 /100 | #18 | Exceptional 98.6% |
| Irish | 100.0 /100 | #19 | Exceptional 98.6% |
| Sioux | 100.0 /100 | #20 | Exceptional 98.6% |
| Arapaho | 100.0 /100 | #21 | Exceptional 98.6% |
| Pennsylvania Germans | 100.0 /100 | #22 | Exceptional 98.6% |
| Finns | 100.0 /100 | #23 | Exceptional 98.6% |
| Lithuanians | 100.0 /100 | #24 | Exceptional 98.6% |
| Danes | 100.0 /100 | #25 | Exceptional 98.6% |
| Scotch-Irish | 100.0 /100 | #26 | Exceptional 98.6% |
Demographics Similar to Comanche by 1st Grade
In terms of 1st grade, the demographic groups most similar to Comanche are Immigrants from Iran (98.0%, a difference of 0.0%), Immigrants from South Central Asia (98.0%, a difference of 0.0%), Dutch West Indian (98.0%, a difference of 0.010%), Immigrants from Moldova (98.0%, a difference of 0.010%), and Soviet Union (98.0%, a difference of 0.010%).
| Demographics | Rating | Rank | 1st Grade |
| Apache | 75.2 /100 | #148 | Good 98.0% |
| Immigrants | Greece | 74.9 /100 | #149 | Good 98.0% |
| Jordanians | 72.7 /100 | #150 | Good 98.0% |
| Dutch West Indians | 69.8 /100 | #151 | Good 98.0% |
| Immigrants | Moldova | 69.5 /100 | #152 | Good 98.0% |
| Soviet Union | 68.9 /100 | #153 | Good 98.0% |
| Immigrants | Iran | 66.9 /100 | #154 | Good 98.0% |
| Comanche | 66.9 /100 | #155 | Good 98.0% |
| Immigrants | South Central Asia | 66.2 /100 | #156 | Good 98.0% |
| Immigrants | North Macedonia | 65.3 /100 | #157 | Good 98.0% |
| Venezuelans | 64.7 /100 | #158 | Good 98.0% |
| French American Indians | 63.7 /100 | #159 | Good 98.0% |
| Immigrants | Russia | 59.2 /100 | #160 | Average 97.9% |
| Immigrants | Italy | 59.1 /100 | #161 | Average 97.9% |
| Immigrants | Eastern Europe | 58.9 /100 | #162 | Average 97.9% |