Nigerian vs Comanche 1st Grade
COMPARE
Nigerian
Comanche
1st Grade
1st Grade Comparison
Nigerians
Comanche
97.6%
1ST GRADE
1.8/ 100
METRIC RATING
238th/ 347
METRIC RANK
98.0%
1ST GRADE
66.9/ 100
METRIC RATING
155th/ 347
METRIC RANK
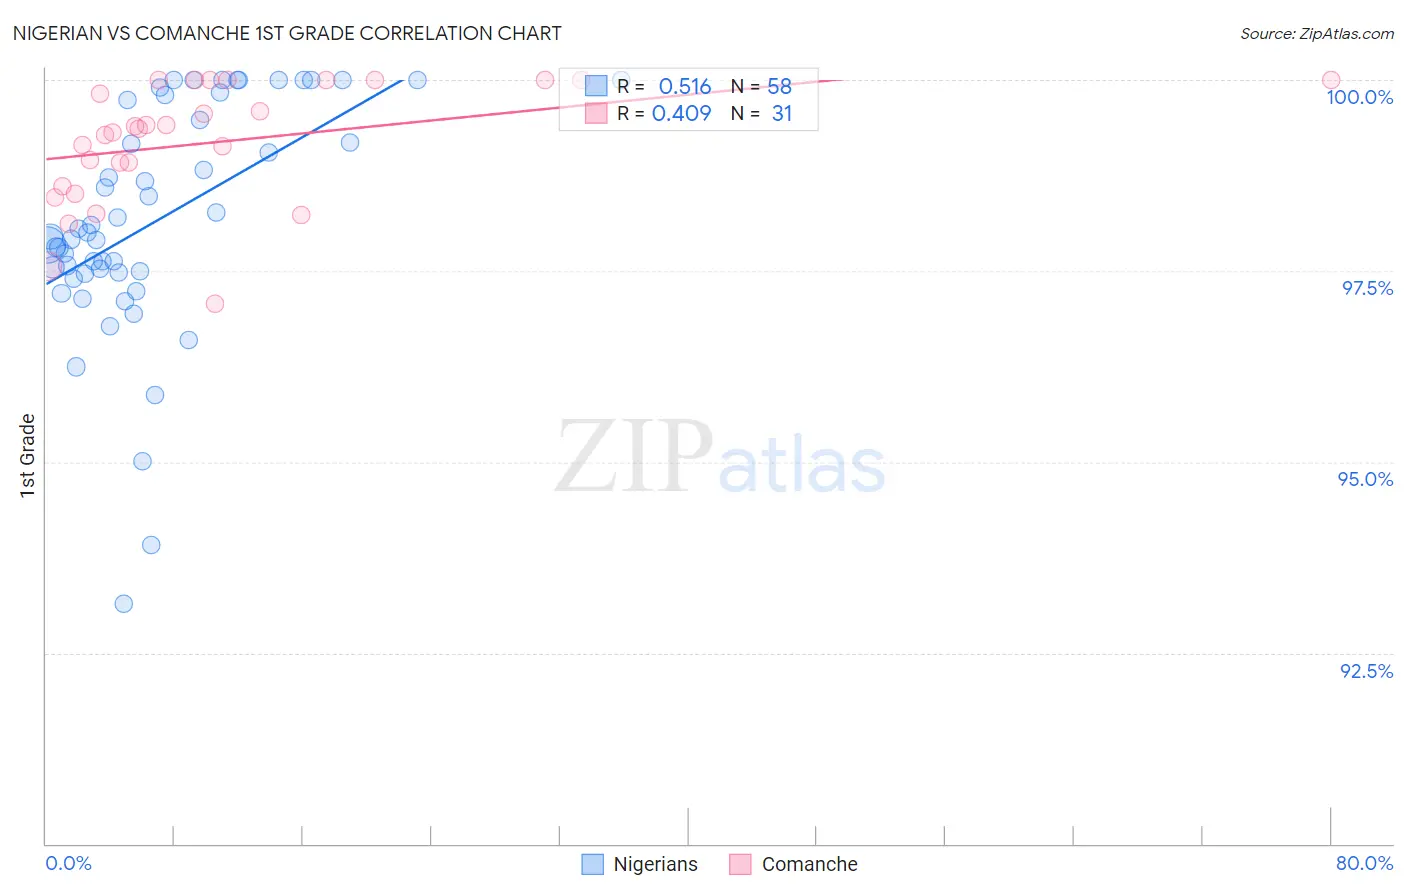
Nigerian vs Comanche 1st Grade Correlation Chart
The statistical analysis conducted on geographies consisting of 332,724,627 people shows a substantial positive correlation between the proportion of Nigerians and percentage of population with at least 1st grade education in the United States with a correlation coefficient (R) of 0.516 and weighted average of 97.6%. Similarly, the statistical analysis conducted on geographies consisting of 109,786,530 people shows a moderate positive correlation between the proportion of Comanche and percentage of population with at least 1st grade education in the United States with a correlation coefficient (R) of 0.409 and weighted average of 98.0%, a difference of 0.37%.
1st Grade Correlation Summary
| Measurement | Nigerian | Comanche |
| Minimum | 93.1% | 97.1% |
| Maximum | 100.0% | 100.0% |
| Range | 6.9% | 2.9% |
| Mean | 98.2% | 99.2% |
| Median | 98.0% | 99.4% |
| Interquartile 25% (IQ1) | 97.5% | 98.6% |
| Interquartile 75% (IQ3) | 99.7% | 100.0% |
| Interquartile Range (IQR) | 2.3% | 1.4% |
| Standard Deviation (Sample) | 1.5% | 0.78% |
| Standard Deviation (Population) | 1.5% | 0.77% |
Similar Demographics by 1st Grade
Demographics Similar to Nigerians by 1st Grade
In terms of 1st grade, the demographic groups most similar to Nigerians are U.S. Virgin Islander (97.6%, a difference of 0.0%), Colombian (97.6%, a difference of 0.010%), Immigrants from Malaysia (97.6%, a difference of 0.010%), Immigrants from Western Asia (97.6%, a difference of 0.010%), and Immigrants from Eastern Asia (97.6%, a difference of 0.010%).
| Demographics | Rating | Rank | 1st Grade |
| Puerto Ricans | 3.0 /100 | #231 | Tragic 97.7% |
| Immigrants | Uruguay | 2.5 /100 | #232 | Tragic 97.6% |
| Immigrants | Pakistan | 2.2 /100 | #233 | Tragic 97.6% |
| Colombians | 2.2 /100 | #234 | Tragic 97.6% |
| Immigrants | Malaysia | 2.1 /100 | #235 | Tragic 97.6% |
| Immigrants | Western Asia | 2.1 /100 | #236 | Tragic 97.6% |
| U.S. Virgin Islanders | 1.9 /100 | #237 | Tragic 97.6% |
| Nigerians | 1.8 /100 | #238 | Tragic 97.6% |
| Immigrants | Eastern Asia | 1.6 /100 | #239 | Tragic 97.6% |
| Koreans | 1.5 /100 | #240 | Tragic 97.6% |
| Liberians | 1.4 /100 | #241 | Tragic 97.6% |
| Immigrants | Indonesia | 1.2 /100 | #242 | Tragic 97.6% |
| Bolivians | 1.2 /100 | #243 | Tragic 97.6% |
| Asians | 1.1 /100 | #244 | Tragic 97.6% |
| South Americans | 1.1 /100 | #245 | Tragic 97.6% |
Demographics Similar to Comanche by 1st Grade
In terms of 1st grade, the demographic groups most similar to Comanche are Immigrants from Iran (98.0%, a difference of 0.0%), Immigrants from South Central Asia (98.0%, a difference of 0.0%), Dutch West Indian (98.0%, a difference of 0.010%), Immigrants from Moldova (98.0%, a difference of 0.010%), and Soviet Union (98.0%, a difference of 0.010%).
| Demographics | Rating | Rank | 1st Grade |
| Apache | 75.2 /100 | #148 | Good 98.0% |
| Immigrants | Greece | 74.9 /100 | #149 | Good 98.0% |
| Jordanians | 72.7 /100 | #150 | Good 98.0% |
| Dutch West Indians | 69.8 /100 | #151 | Good 98.0% |
| Immigrants | Moldova | 69.5 /100 | #152 | Good 98.0% |
| Soviet Union | 68.9 /100 | #153 | Good 98.0% |
| Immigrants | Iran | 66.9 /100 | #154 | Good 98.0% |
| Comanche | 66.9 /100 | #155 | Good 98.0% |
| Immigrants | South Central Asia | 66.2 /100 | #156 | Good 98.0% |
| Immigrants | North Macedonia | 65.3 /100 | #157 | Good 98.0% |
| Venezuelans | 64.7 /100 | #158 | Good 98.0% |
| French American Indians | 63.7 /100 | #159 | Good 98.0% |
| Immigrants | Russia | 59.2 /100 | #160 | Average 97.9% |
| Immigrants | Italy | 59.1 /100 | #161 | Average 97.9% |
| Immigrants | Eastern Europe | 58.9 /100 | #162 | Average 97.9% |