White/Caucasian vs Immigrants from Grenada 3rd Grade
COMPARE
White/Caucasian
Immigrants from Grenada
3rd Grade
3rd Grade Comparison
Whites/Caucasians
Immigrants from Grenada
98.3%
3RD GRADE
99.8/ 100
METRIC RATING
52nd/ 347
METRIC RANK
97.0%
3RD GRADE
0.0/ 100
METRIC RATING
293rd/ 347
METRIC RANK
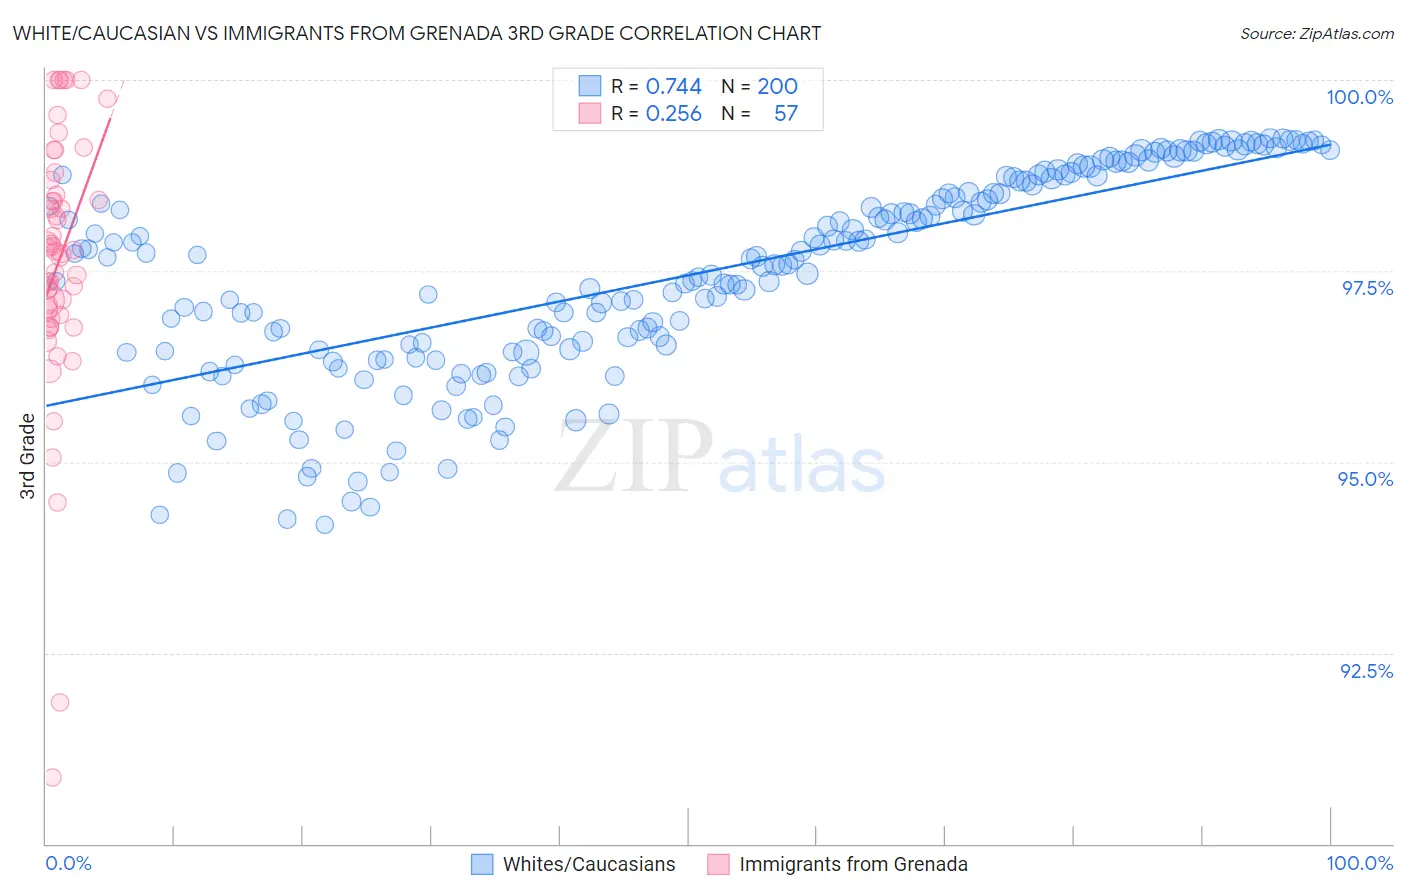
White/Caucasian vs Immigrants from Grenada 3rd Grade Correlation Chart
The statistical analysis conducted on geographies consisting of 585,247,393 people shows a strong positive correlation between the proportion of Whites/Caucasians and percentage of population with at least 3rd grade education in the United States with a correlation coefficient (R) of 0.744 and weighted average of 98.3%. Similarly, the statistical analysis conducted on geographies consisting of 67,199,570 people shows a weak positive correlation between the proportion of Immigrants from Grenada and percentage of population with at least 3rd grade education in the United States with a correlation coefficient (R) of 0.256 and weighted average of 97.0%, a difference of 1.3%.
3rd Grade Correlation Summary
| Measurement | White/Caucasian | Immigrants from Grenada |
| Minimum | 94.2% | 90.9% |
| Maximum | 99.2% | 100.0% |
| Range | 5.1% | 9.1% |
| Mean | 97.4% | 97.6% |
| Median | 97.6% | 97.8% |
| Interquartile 25% (IQ1) | 96.4% | 96.9% |
| Interquartile 75% (IQ3) | 98.7% | 98.6% |
| Interquartile Range (IQR) | 2.2% | 1.7% |
| Standard Deviation (Sample) | 1.3% | 1.7% |
| Standard Deviation (Population) | 1.3% | 1.7% |
Similar Demographics by 3rd Grade
Demographics Similar to Whites/Caucasians by 3rd Grade
In terms of 3rd grade, the demographic groups most similar to Whites/Caucasians are Estonian (98.3%, a difference of 0.0%), Celtic (98.3%, a difference of 0.0%), Australian (98.3%, a difference of 0.0%), Immigrants from Scotland (98.3%, a difference of 0.010%), and Bulgarian (98.3%, a difference of 0.010%).
| Demographics | Rating | Rank | 3rd Grade |
| Native Hawaiians | 99.9 /100 | #45 | Exceptional 98.3% |
| Ottawa | 99.8 /100 | #46 | Exceptional 98.3% |
| Czechoslovakians | 99.8 /100 | #47 | Exceptional 98.3% |
| Lumbee | 99.8 /100 | #48 | Exceptional 98.3% |
| Estonians | 99.8 /100 | #49 | Exceptional 98.3% |
| Celtics | 99.8 /100 | #50 | Exceptional 98.3% |
| Australians | 99.8 /100 | #51 | Exceptional 98.3% |
| Whites/Caucasians | 99.8 /100 | #52 | Exceptional 98.3% |
| Immigrants | Scotland | 99.8 /100 | #53 | Exceptional 98.3% |
| Bulgarians | 99.8 /100 | #54 | Exceptional 98.3% |
| Americans | 99.8 /100 | #55 | Exceptional 98.3% |
| Austrians | 99.8 /100 | #56 | Exceptional 98.3% |
| Slavs | 99.7 /100 | #57 | Exceptional 98.3% |
| Greeks | 99.7 /100 | #58 | Exceptional 98.3% |
| Maltese | 99.7 /100 | #59 | Exceptional 98.3% |
Demographics Similar to Immigrants from Grenada by 3rd Grade
In terms of 3rd grade, the demographic groups most similar to Immigrants from Grenada are Malaysian (97.0%, a difference of 0.010%), Immigrants from Eritrea (97.0%, a difference of 0.020%), British West Indian (97.0%, a difference of 0.030%), Immigrants from Portugal (97.0%, a difference of 0.040%), and Immigrants from Afghanistan (97.0%, a difference of 0.040%).
| Demographics | Rating | Rank | 3rd Grade |
| Immigrants | Barbados | 0.0 /100 | #286 | Tragic 97.1% |
| Immigrants | St. Vincent and the Grenadines | 0.0 /100 | #287 | Tragic 97.1% |
| Immigrants | West Indies | 0.0 /100 | #288 | Tragic 97.1% |
| Immigrants | Thailand | 0.0 /100 | #289 | Tragic 97.1% |
| Immigrants | Portugal | 0.0 /100 | #290 | Tragic 97.0% |
| Immigrants | Afghanistan | 0.0 /100 | #291 | Tragic 97.0% |
| British West Indians | 0.0 /100 | #292 | Tragic 97.0% |
| Immigrants | Grenada | 0.0 /100 | #293 | Tragic 97.0% |
| Malaysians | 0.0 /100 | #294 | Tragic 97.0% |
| Immigrants | Eritrea | 0.0 /100 | #295 | Tragic 97.0% |
| Immigrants | Immigrants | 0.0 /100 | #296 | Tragic 96.9% |
| Haitians | 0.0 /100 | #297 | Tragic 96.9% |
| Immigrants | Dominica | 0.0 /100 | #298 | Tragic 96.9% |
| Somalis | 0.0 /100 | #299 | Tragic 96.8% |
| Immigrants | South Eastern Asia | 0.0 /100 | #300 | Tragic 96.8% |