White/Caucasian vs Immigrants from Haiti 3rd Grade
COMPARE
White/Caucasian
Immigrants from Haiti
3rd Grade
3rd Grade Comparison
Whites/Caucasians
Immigrants from Haiti
98.3%
3RD GRADE
99.8/ 100
METRIC RATING
52nd/ 347
METRIC RANK
96.7%
3RD GRADE
0.0/ 100
METRIC RATING
308th/ 347
METRIC RANK
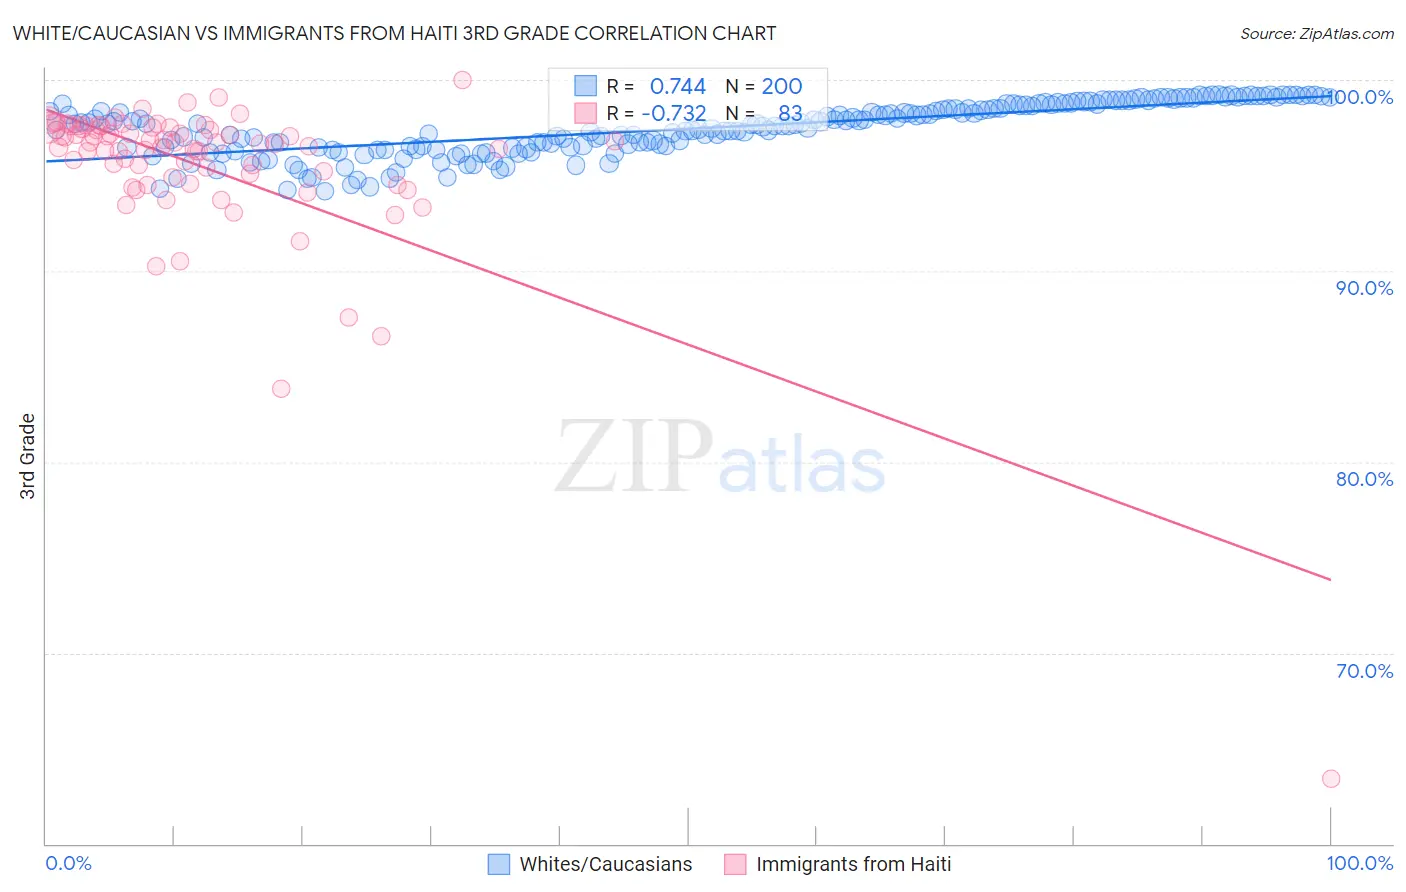
White/Caucasian vs Immigrants from Haiti 3rd Grade Correlation Chart
The statistical analysis conducted on geographies consisting of 585,247,393 people shows a strong positive correlation between the proportion of Whites/Caucasians and percentage of population with at least 3rd grade education in the United States with a correlation coefficient (R) of 0.744 and weighted average of 98.3%. Similarly, the statistical analysis conducted on geographies consisting of 225,286,718 people shows a strong negative correlation between the proportion of Immigrants from Haiti and percentage of population with at least 3rd grade education in the United States with a correlation coefficient (R) of -0.732 and weighted average of 96.7%, a difference of 1.7%.
3rd Grade Correlation Summary
| Measurement | White/Caucasian | Immigrants from Haiti |
| Minimum | 94.2% | 63.4% |
| Maximum | 99.2% | 100.0% |
| Range | 5.1% | 36.6% |
| Mean | 97.4% | 95.5% |
| Median | 97.6% | 96.6% |
| Interquartile 25% (IQ1) | 96.4% | 94.9% |
| Interquartile 75% (IQ3) | 98.7% | 97.5% |
| Interquartile Range (IQR) | 2.2% | 2.6% |
| Standard Deviation (Sample) | 1.3% | 4.4% |
| Standard Deviation (Population) | 1.3% | 4.4% |
Similar Demographics by 3rd Grade
Demographics Similar to Whites/Caucasians by 3rd Grade
In terms of 3rd grade, the demographic groups most similar to Whites/Caucasians are Estonian (98.3%, a difference of 0.0%), Celtic (98.3%, a difference of 0.0%), Australian (98.3%, a difference of 0.0%), Immigrants from Scotland (98.3%, a difference of 0.010%), and Bulgarian (98.3%, a difference of 0.010%).
| Demographics | Rating | Rank | 3rd Grade |
| Native Hawaiians | 99.9 /100 | #45 | Exceptional 98.3% |
| Ottawa | 99.8 /100 | #46 | Exceptional 98.3% |
| Czechoslovakians | 99.8 /100 | #47 | Exceptional 98.3% |
| Lumbee | 99.8 /100 | #48 | Exceptional 98.3% |
| Estonians | 99.8 /100 | #49 | Exceptional 98.3% |
| Celtics | 99.8 /100 | #50 | Exceptional 98.3% |
| Australians | 99.8 /100 | #51 | Exceptional 98.3% |
| Whites/Caucasians | 99.8 /100 | #52 | Exceptional 98.3% |
| Immigrants | Scotland | 99.8 /100 | #53 | Exceptional 98.3% |
| Bulgarians | 99.8 /100 | #54 | Exceptional 98.3% |
| Americans | 99.8 /100 | #55 | Exceptional 98.3% |
| Austrians | 99.8 /100 | #56 | Exceptional 98.3% |
| Slavs | 99.7 /100 | #57 | Exceptional 98.3% |
| Greeks | 99.7 /100 | #58 | Exceptional 98.3% |
| Maltese | 99.7 /100 | #59 | Exceptional 98.3% |
Demographics Similar to Immigrants from Haiti by 3rd Grade
In terms of 3rd grade, the demographic groups most similar to Immigrants from Haiti are Nicaraguan (96.7%, a difference of 0.0%), Sri Lankan (96.7%, a difference of 0.0%), Guyanese (96.7%, a difference of 0.020%), Cape Verdean (96.6%, a difference of 0.030%), and Central American Indian (96.7%, a difference of 0.050%).
| Demographics | Rating | Rank | 3rd Grade |
| Immigrants | Cuba | 0.0 /100 | #301 | Tragic 96.8% |
| Immigrants | Somalia | 0.0 /100 | #302 | Tragic 96.8% |
| Ecuadorians | 0.0 /100 | #303 | Tragic 96.7% |
| Immigrants | Caribbean | 0.0 /100 | #304 | Tragic 96.7% |
| Central American Indians | 0.0 /100 | #305 | Tragic 96.7% |
| Guyanese | 0.0 /100 | #306 | Tragic 96.7% |
| Nicaraguans | 0.0 /100 | #307 | Tragic 96.7% |
| Immigrants | Haiti | 0.0 /100 | #308 | Tragic 96.7% |
| Sri Lankans | 0.0 /100 | #309 | Tragic 96.7% |
| Cape Verdeans | 0.0 /100 | #310 | Tragic 96.6% |
| Immigrants | Guyana | 0.0 /100 | #311 | Tragic 96.6% |
| Immigrants | Laos | 0.0 /100 | #312 | Tragic 96.6% |
| Immigrants | Ecuador | 0.0 /100 | #313 | Tragic 96.6% |
| Belizeans | 0.0 /100 | #314 | Tragic 96.6% |
| Immigrants | Azores | 0.0 /100 | #315 | Tragic 96.6% |