Puget Sound Salish vs Immigrants from Grenada 3rd Grade
COMPARE
Puget Sound Salish
Immigrants from Grenada
3rd Grade
3rd Grade Comparison
Puget Sound Salish
Immigrants from Grenada
98.1%
3RD GRADE
97.9/ 100
METRIC RATING
101st/ 347
METRIC RANK
97.0%
3RD GRADE
0.0/ 100
METRIC RATING
293rd/ 347
METRIC RANK
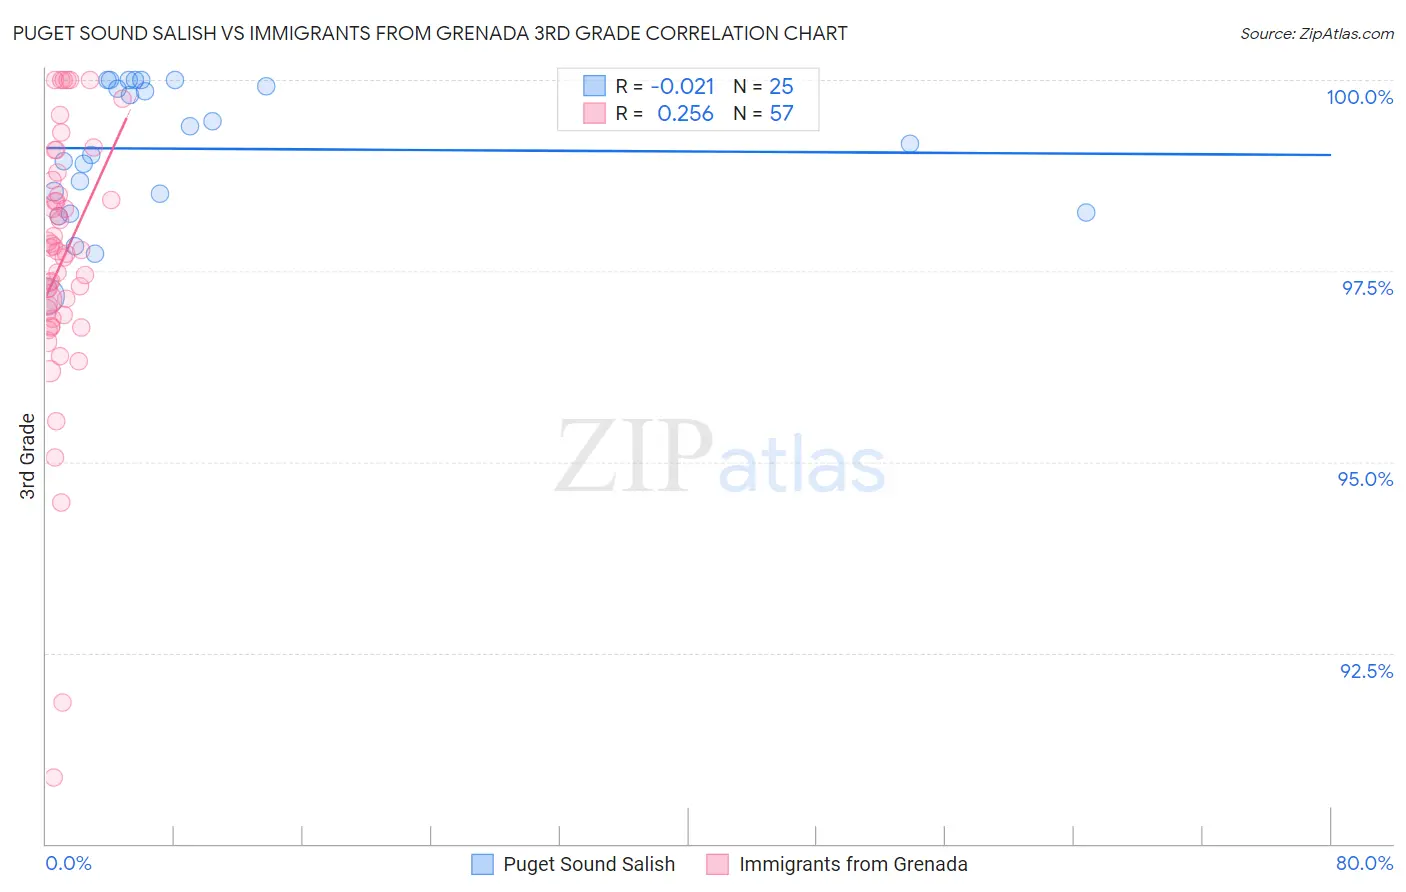
Puget Sound Salish vs Immigrants from Grenada 3rd Grade Correlation Chart
The statistical analysis conducted on geographies consisting of 46,155,746 people shows no correlation between the proportion of Puget Sound Salish and percentage of population with at least 3rd grade education in the United States with a correlation coefficient (R) of -0.021 and weighted average of 98.1%. Similarly, the statistical analysis conducted on geographies consisting of 67,199,570 people shows a weak positive correlation between the proportion of Immigrants from Grenada and percentage of population with at least 3rd grade education in the United States with a correlation coefficient (R) of 0.256 and weighted average of 97.0%, a difference of 1.1%.
3rd Grade Correlation Summary
| Measurement | Puget Sound Salish | Immigrants from Grenada |
| Minimum | 97.2% | 90.9% |
| Maximum | 100.0% | 100.0% |
| Range | 2.8% | 9.1% |
| Mean | 99.1% | 97.6% |
| Median | 99.2% | 97.8% |
| Interquartile 25% (IQ1) | 98.4% | 96.9% |
| Interquartile 75% (IQ3) | 100.0% | 98.6% |
| Interquartile Range (IQR) | 1.6% | 1.7% |
| Standard Deviation (Sample) | 0.86% | 1.7% |
| Standard Deviation (Population) | 0.84% | 1.7% |
Similar Demographics by 3rd Grade
Demographics Similar to Puget Sound Salish by 3rd Grade
In terms of 3rd grade, the demographic groups most similar to Puget Sound Salish are Romanian (98.1%, a difference of 0.0%), Cree (98.1%, a difference of 0.0%), Nonimmigrants (98.1%, a difference of 0.0%), South African (98.1%, a difference of 0.010%), and Choctaw (98.1%, a difference of 0.010%).
| Demographics | Rating | Rank | 3rd Grade |
| Immigrants | Germany | 98.4 /100 | #94 | Exceptional 98.1% |
| Cypriots | 98.4 /100 | #95 | Exceptional 98.1% |
| Immigrants | Ireland | 98.2 /100 | #96 | Exceptional 98.1% |
| South Africans | 98.2 /100 | #97 | Exceptional 98.1% |
| Choctaw | 98.0 /100 | #98 | Exceptional 98.1% |
| Romanians | 98.0 /100 | #99 | Exceptional 98.1% |
| Cree | 97.9 /100 | #100 | Exceptional 98.1% |
| Puget Sound Salish | 97.9 /100 | #101 | Exceptional 98.1% |
| Immigrants | Nonimmigrants | 97.8 /100 | #102 | Exceptional 98.1% |
| Yugoslavians | 97.7 /100 | #103 | Exceptional 98.1% |
| Turks | 97.6 /100 | #104 | Exceptional 98.1% |
| German Russians | 97.2 /100 | #105 | Exceptional 98.1% |
| Bhutanese | 97.2 /100 | #106 | Exceptional 98.1% |
| Immigrants | Czechoslovakia | 97.0 /100 | #107 | Exceptional 98.0% |
| Immigrants | Singapore | 96.7 /100 | #108 | Exceptional 98.0% |
Demographics Similar to Immigrants from Grenada by 3rd Grade
In terms of 3rd grade, the demographic groups most similar to Immigrants from Grenada are Malaysian (97.0%, a difference of 0.010%), Immigrants from Eritrea (97.0%, a difference of 0.020%), British West Indian (97.0%, a difference of 0.030%), Immigrants from Portugal (97.0%, a difference of 0.040%), and Immigrants from Afghanistan (97.0%, a difference of 0.040%).
| Demographics | Rating | Rank | 3rd Grade |
| Immigrants | Barbados | 0.0 /100 | #286 | Tragic 97.1% |
| Immigrants | St. Vincent and the Grenadines | 0.0 /100 | #287 | Tragic 97.1% |
| Immigrants | West Indies | 0.0 /100 | #288 | Tragic 97.1% |
| Immigrants | Thailand | 0.0 /100 | #289 | Tragic 97.1% |
| Immigrants | Portugal | 0.0 /100 | #290 | Tragic 97.0% |
| Immigrants | Afghanistan | 0.0 /100 | #291 | Tragic 97.0% |
| British West Indians | 0.0 /100 | #292 | Tragic 97.0% |
| Immigrants | Grenada | 0.0 /100 | #293 | Tragic 97.0% |
| Malaysians | 0.0 /100 | #294 | Tragic 97.0% |
| Immigrants | Eritrea | 0.0 /100 | #295 | Tragic 97.0% |
| Immigrants | Immigrants | 0.0 /100 | #296 | Tragic 96.9% |
| Haitians | 0.0 /100 | #297 | Tragic 96.9% |
| Immigrants | Dominica | 0.0 /100 | #298 | Tragic 96.9% |
| Somalis | 0.0 /100 | #299 | Tragic 96.8% |
| Immigrants | South Eastern Asia | 0.0 /100 | #300 | Tragic 96.8% |